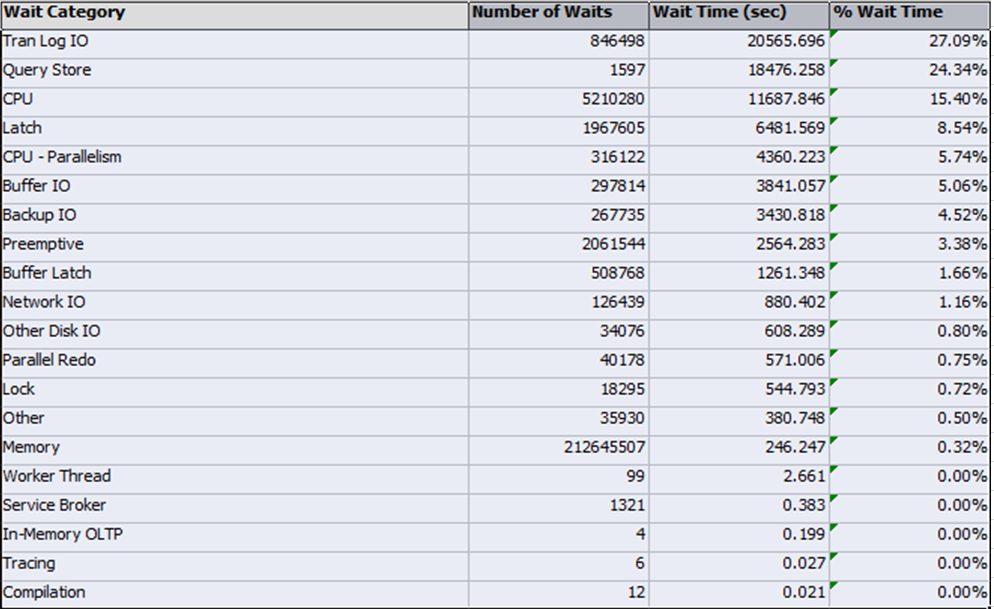
compared to what?
This report stinks for a couple reasons:
- It doesn't tell you how long the server has been up
- It doesn't tell you how long each wait lasted on average
I wouldn't use this to try to figure anything out, because:
- The percentages are only compared to all other collected waits
- Something could be happening a lot, but also happening very quickly
- Something could be happening infrequently, but lasting a long time
Waits are typically something you need to track and trend over time to better understand when they're happening and what their impact is on the workload (if any). Remember that waits will happen even when there's nothing bad happening. They don't indicate an issue merely by existing.
If this is a server you care about, find a monitoring tool that meets your observational requirements.

