added 100 characters in body
Source Link
Magier
  • 4.8k
  • 8
  • 47
  • 89

More than one year later I want to let everyone know my experience and the final result of this question / topic.

I started out creating things on my own. Initially I followed the Article Collect and store historical SQL Server performance counter data with CMVs ofby Tim Ford to get something up and extended this with whatever Data I wanted to collect. So oneonce a per day I run several stored procedures on each Sql Server that collect some specific information from DMVs and stores the results on the local Server inside of a database. This includes index usage, missing indexes, specific log entries like autogrow, server settings, application database settings, fragmentation, job execution, transaction log info, file information, wait stats and more.

Additionally I added Brent Ozar's sp_blitz regulary execution results to this repository to collect additional valuable indcicationsindications to work, improve and report.

All data is lateron collected from there into a dedicated monitoring Sql Server and this way I create a bundeled store for performance relevant information about all my servers and use this aas a base for investigation and reporting.

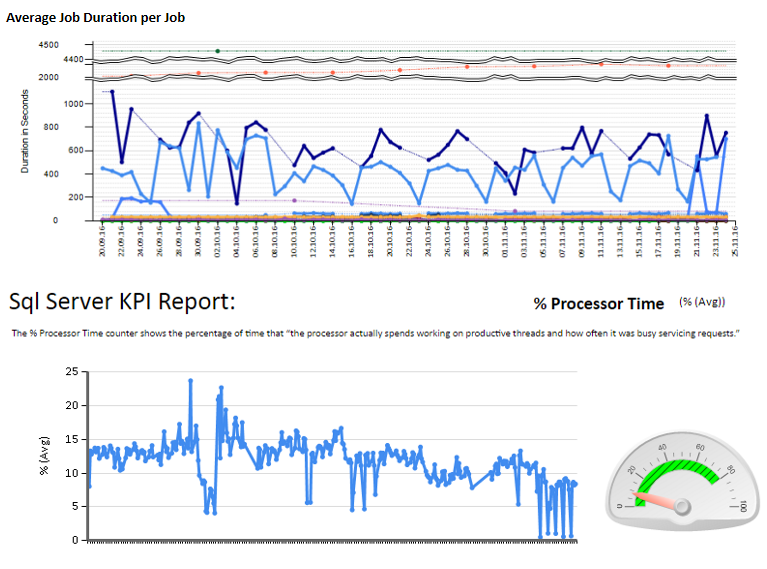
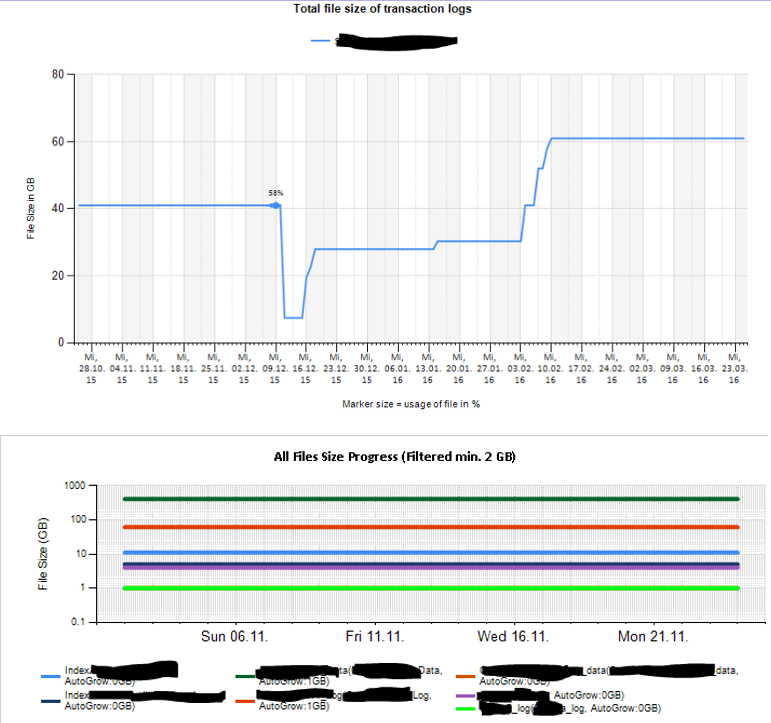
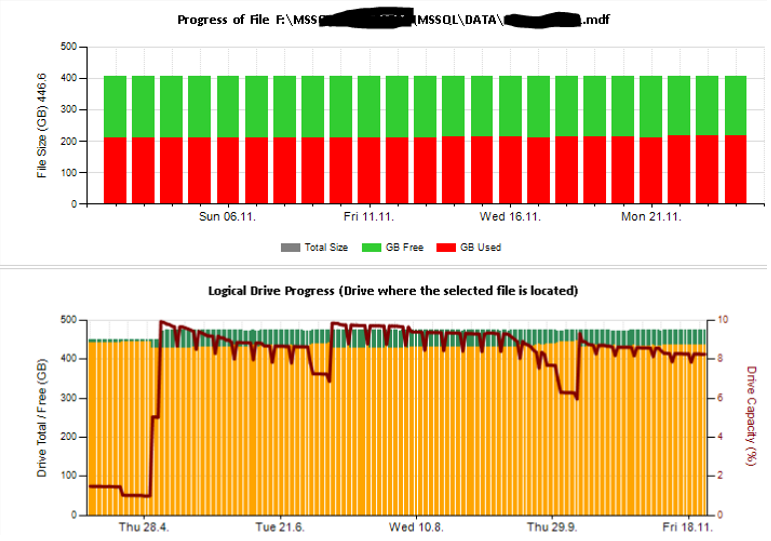
Then I created excel sheets and also reports using reporting services to analyze and interpret. Some samples:

enter image description here enter image description here enter image description here

Also I configured some performance counters monitoring using TYPEPERF inspired by the article "Collecting Performance Data into a SQL Server Table" by Fedor Georgiev.

From my SQL Monitoring instance I trigger typeperf to run and collect a configurable number of samples with a configurable sampleinterval and store the results in my central monitoring db.

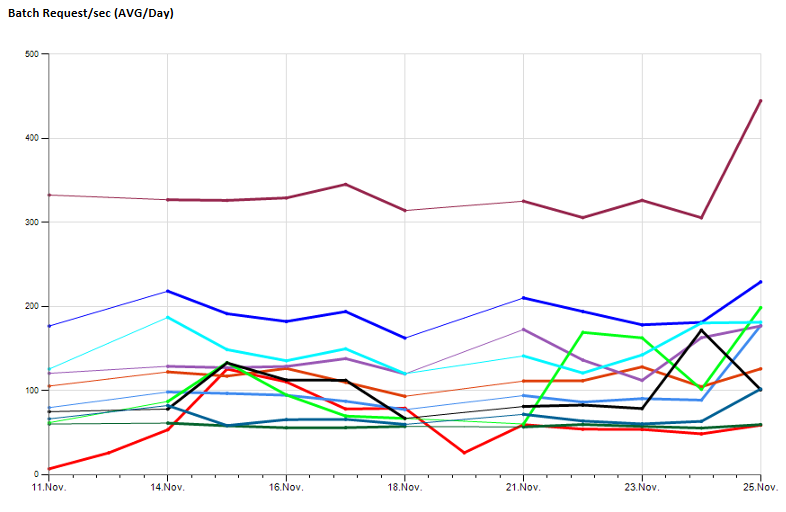
This allows me to observer longterm performance values, sample:

enter image description here

After a while of using this to gather baseline information, it tunred out that it is quite a lot of maintenance work that has to be spent on looking at failed jobs, de-buggin procedures (for example in case a DB was taken offline, some scripts failed), maintaining settings after a server was replaced...). Also

Also the database collectiongcollecting all the records tiself needs maintenance and performance tuning, so additional work comes up tito keep the data useful...

What is finally completely missing is the ability to look at things that happen live. IfIn Best Case, I amwill be able to tell what was possibly going on the next day after the data collectors have ran. Also all the details are missing. I do not have access to deadlock graphs, I can't look at query plans of queries that were running in a suspicious timeframe....

All of that made me going to charge management to spend money for a prefessional solution I am not able to create on my own.

The final choice was to buy SentryOne because in comparison to others it is convincing and delivers a lot of information required to identify our pain points.

As a final conclusion I would advice anyone looking for answers to similar question not to try creating things on their own as long as you don't have a small and basically healthy environment in place. If you have couple of systems and a lot of problems, better immedeately go for a professional solution immediately and use the assistence of the vendor on your problems instead of spending a lot of time and money to create somehing less useful. However, this route was still very interesting and made me learn a lot I dont want to miss.

I hope you find this useful once you ran into this question thread.

EDIT April 20, 2017: Brent Ozar recently posted the following article on facebook that is kind of a simiar approach taken by the SQL Tiger Team: https://blogs.msdn.microsoft.com/sql_server_team/sql-server-performance-baselining-reports-unleashed-for-enterprise-monitoring/

More than one year later I want to let everyone know my experience and the final result of this question / topic.

I started out creating things on my own. Initially I followed the Article Collect and store historical SQL Server performance counter data with CMVs of Tim Ford to get something up and extended this with whatever Data I wanted to collect. So one a day I run several stored procedures on each Sql Server that collect some specific information from DMVs and stores the results on the local Server inside of a database. This includes index usage, missing indexes, specific log entries like autogrow, server settings, application database settings, fragmentation, job execution, transaction log info, file information, wait stats and more.

Additionally I added Brent Ozar's sp_blitz regulary execution results to this repository to collect additional valuable indcications to work, improve and report.

All data is lateron collected from there into a dedicated monitoring Sql Server and this way I create a bundeled store for performance relevant information about all my servers and use this a a base for investigation and reporting.

Then I created excel sheets and also reports using reporting services to analyze and interpret. Some samples:

enter image description here enter image description here enter image description here

Also I configured some performance counters monitoring using TYPEPERF inspired by the article "Collecting Performance Data into a SQL Server Table" by Fedor Georgiev.

From my SQL Monitoring instance I trigger typeperf to run and collect a configurable number of samples with a configurable sampleinterval and store the results in my central monitoring db.

This allows me to observer longterm performance values, sample:

enter image description here

After a while of using this to gather baseline information, it tunred out that it is quite a lot of maintenance work that has to be spent on looking at failed jobs, de-buggin procedures (for example in case a DB was taken offline, some scripts failed), maintaining settings after a server was replaced...). Also the database collectiong all the records tiself needs maintenance and performance tuning, so additional work comes up ti keep the data useful...

What is finally completely missing is the ability to look at things that happen live. If, I am able to tell what was possibly going on the next day after the data collectors have ran. Also all the details are missing. I do not have access to deadlock graphs, I can't look at query plans of queries that were running in a suspicious timeframe....

All of that made me going to charge management to spend money for a prefessional solution I am not able to create on my own.

The final choice was to buy SentryOne because in comparison to others it is convincing and delivers a lot of information required to identify our pain points.

As a final conclusion I would advice anyone looking for answers to similar question not to try creating things on their own as long as you don't have a small and basically healthy environment in place. If you have couple of systems and a lot of problems, better immedeately go for a professional solution immediately and use the assistence of the vendor on your problems instead of spending a lot of time and money to create somehing less useful.

I hope you find this useful once you ran into this question thread.

EDIT April 20, 2017: Brent Ozar recently posted the following article on facebook that is kind of a simiar approach taken by the SQL Tiger Team: https://blogs.msdn.microsoft.com/sql_server_team/sql-server-performance-baselining-reports-unleashed-for-enterprise-monitoring/
More than one year later I want to let everyone know my experience and the final result of this question / topic.

I started out creating things on my own. Initially I followed the Article Collect and store historical SQL Server performance counter data with CMVs by Tim Ford to get something up and extended this with whatever Data I wanted to collect. So once a per day I run several stored procedures on each Sql Server that collect some specific information from DMVs and stores the results on the local Server inside of a database. This includes index usage, missing indexes, specific log entries like autogrow, server settings, application database settings, fragmentation, job execution, transaction log info, file information, wait stats and more.

Additionally I added Brent Ozar's sp_blitz regulary execution results to this repository to collect additional valuable indications to work, improve and report.

All data is lateron collected from there into a dedicated monitoring Sql Server and this way I create a bundeled store for performance relevant information about all my servers and use this as a base for investigation and reporting.

Then I created excel sheets and also reports using reporting services to analyze and interpret. Some samples:

enter image description here enter image description here enter image description here

Also I configured some performance counters monitoring using TYPEPERF inspired by the article "Collecting Performance Data into a SQL Server Table" by Fedor Georgiev.

From my SQL Monitoring instance I trigger typeperf to run and collect a configurable number of samples with a configurable sampleinterval and store the results in my central monitoring db.

This allows me to observer longterm performance values, sample:

enter image description here

After a while of using this to gather baseline information, it tunred out that it is quite a lot of maintenance work that has to be spent on looking at failed jobs, de-buggin procedures (for example in case a DB was taken offline, some scripts failed), maintaining settings after a server was replaced...

Also the database collecting all the records tiself needs maintenance and performance tuning, so additional work comes up to keep the data useful...

What is finally completely missing is the ability to look at things that happen live. In Best Case, I will be able to tell what was possibly going on the next day after the data collectors have ran. Also all the details are missing. I do not have access to deadlock graphs, I can't look at query plans of queries that were running in a suspicious timeframe....

All of that made me going to charge management to spend money for a prefessional solution I am not able to create on my own.

The final choice was to buy SentryOne because in comparison to others it is convincing and delivers a lot of information required to identify our pain points.

As a final conclusion I would advice anyone looking for answers to similar question not to try creating things on their own as long as you don't have a small and basically healthy environment in place. If you have couple of systems and a lot of problems, better immedeately go for a professional solution and use the assistence of the vendor on your problems instead of spending a lot of time and money to create somehing less useful. However, this route was still very interesting and made me learn a lot I dont want to miss.

I hope you find this useful once you ran into this question thread.

EDIT April 20, 2017: Brent Ozar recently posted the following article on facebook that is kind of a simiar approach taken by the SQL Tiger Team: https://blogs.msdn.microsoft.com/sql_server_team/sql-server-performance-baselining-reports-unleashed-for-enterprise-monitoring/
Added Tiger Team aproach
Source Link
Magier
  • 4.8k
  • 8
  • 47
  • 89

More than one year later I want to let everyone know my experience and the final result of this question / topic.

I started out creating things on my own. Initially I followed the Article Collect and store historical SQL Server performance counter data with CMVs of Tim Ford to get something up and extended this with whatever Data I wanted to collect. So one a day I run several stored procedures on each Sql Server that collect some specific information from DMVs and stores the results on the local Server inside of a database. This includes index usage, missing indexes, specific log entries like autogrow, server settings, application database settings, fragmentation, job execution, transaction log info, file information, wait stats and more.

Additionally I added Brent Ozar's sp_blitz regulary execution results to this repository to collect additional valuable indcications to work, improve and report.

All data is lateron collected from there into a dedicated monitoring Sql Server and this way I create a bundeled store for performance relevant information about all my servers and use this a a base for investigation and reporting.

Then I created excel sheets and also reports using reporting services to analyze and interpret. Some samples:

enter image description here enter image description here enter image description here

Also I configured some performance counters monitoring using TYPEPERF inspired by the article "Collecting Performance Data into a SQL Server Table" by Fedor Georgiev.

From my SQL Monitoring instance I trigger typeperf to run and collect a configurable number of samples with a configurable sampleinterval and store the results in my central monitoring db.

This allows me to observer longterm performance values, sample:

enter image description here

After a while of using this to gather baseline information, it tunred out that it is quite a lot of maintenance work that has to be spent on looking at failed jobs, de-buggin procedures (for example in case a DB was taken offline, some scripts failed), maintaining settings after a server was replaced...). Also the database collectiong all the records tiself needs maintenance and performance tuning, so additional work comes up ti keep the data useful...

What is finally completely missing is the ability to look at things that happen live. If, I am able to tell what was possibly going on the next day after the data collectors have ran. Also all the details are missing. I do not have access to deadlock graphs, I can't look at query plans of queries that were running in a suspicious timeframe....

All of that made me going to charge management to spend money for a prefessional solution I am not able to create on my own.

The final choice was to buy SentryOne because in comparison to others it is convincing and delivers a lot of information required to identify our pain points.

As a final conclusion I would advice anyone looking for answers to similar question not to try creating things on their own as long as you don't have a small and basically healthy environment in place. If you have couple of systems and a lot of problems, better immedeately go for a professional solution immediately and use the assistence of the vendor on your problems instead of spending a lot of time and money to create somehing less useful.

I hope you find this useful once you ran into this question thread.

EDIT April 20, 2017: Brent Ozar recently posted the following article on facebook that is kind of a simiar approach taken by the SQL Tiger Team: https://blogs.msdn.microsoft.com/sql_server_team/sql-server-performance-baselining-reports-unleashed-for-enterprise-monitoring/
More than one year later I want to let everyone know my experience and the final result of this question / topic.

I started out creating things on my own. Initially I followed the Article Collect and store historical SQL Server performance counter data with CMVs of Tim Ford to get something up and extended this with whatever Data I wanted to collect. So one a day I run several stored procedures on each Sql Server that collect some specific information from DMVs and stores the results on the local Server inside of a database. This includes index usage, missing indexes, specific log entries like autogrow, server settings, application database settings, fragmentation, job execution, transaction log info, file information, wait stats and more.

Additionally I added Brent Ozar's sp_blitz regulary execution results to this repository to collect additional valuable indcications to work, improve and report.

All data is lateron collected from there into a dedicated monitoring Sql Server and this way I create a bundeled store for performance relevant information about all my servers and use this a a base for investigation and reporting.

Then I created excel sheets and also reports using reporting services to analyze and interpret. Some samples:

enter image description here enter image description here enter image description here

Also I configured some performance counters monitoring using TYPEPERF inspired by the article "Collecting Performance Data into a SQL Server Table" by Fedor Georgiev.

From my SQL Monitoring instance I trigger typeperf to run and collect a configurable number of samples with a configurable sampleinterval and store the results in my central monitoring db.

This allows me to observer longterm performance values, sample:

enter image description here

After a while of using this to gather baseline information, it tunred out that it is quite a lot of maintenance work that has to be spent on looking at failed jobs, de-buggin procedures (for example in case a DB was taken offline, some scripts failed), maintaining settings after a server was replaced...). Also the database collectiong all the records tiself needs maintenance and performance tuning, so additional work comes up ti keep the data useful...

What is finally completely missing is the ability to look at things that happen live. If, I am able to tell what was possibly going on the next day after the data collectors have ran. Also all the details are missing. I do not have access to deadlock graphs, I can't look at query plans of queries that were running in a suspicious timeframe....

All of that made me going to charge management to spend money for a prefessional solution I am not able to create on my own.

The final choice was to buy SentryOne because in comparison to others it is convincing and delivers a lot of information required to identify our pain points.

As a final conclusion I would advice anyone looking for answers to similar question not to try creating things on their own as long as you don't have a small and basically healthy environment in place. If you have couple of systems and a lot of problems, better immedeately go for a professional solution immediately and use the assistence of the vendor on your problems instead of spending a lot of time and money to create somehing less useful.

I hope you find this useful once you ran into this question thread.

EDIT April 20, 2017: Brent Ozar recently posted the following article on facebook that is kind of a simiar approach taken by the SQL Tiger Team: https://blogs.msdn.microsoft.com/sql_server_team/sql-server-performance-baselining-reports-unleashed-for-enterprise-monitoring/

added 450 characters in body
Source Link
Magier
  • 4.8k
  • 8
  • 47
  • 89

More than one year later I want to let everyone know my experience and the final result of this question / topic.

I started out creating things on my own. Initially I followed the Article Collect and store historical SQL Server performance counter data with CMVs of Tim Ford to get something up and extended this with whatever Data I wanted to collect. So one a day I run several stored procedures on each Sql Server that collect some specific information from DMVs and stores the results on the local Server inside of a database. This includes index usage, missing indexes, specific log entries like autogrow, server settings, application database settings, fragmentation, job execution, transaction log info, file information, wait stats and more.

Additionally I added Brent Ozar's sp_blitz regulary execution results to this repository to collect additional valuable indcications to work, improve and report.

All data is lateron collected from there into a dedicated monitoring Sql Server and this way I create a bundeled store for performance relevant information about all my servers and use this a a base for investigation and reporting.

Then I created excel sheets and also reports using reporting services to analyze and interpret. Some samples:

enter image description here enter image description here enter image description here

Also I configured some performance counters monitoring using TYPEPERF inspired by the article "Collecting Performance Data into a SQL Server Table" by Fedor Georgiev.

From my SQL Monitoring instance I trigger typeperf to run and collect a configurable number of samples with a configurable sampleinterval and store the results in my central monitoring db.

This allows me to observer longterm performance values, sample:

enter image description here

After a while of using this to gather baseline information, it tunred out that it is quite a lot of maintenance work that has to be spent on looking at failed jobs, de-buggin procedures (for example in case a DB was taken offline, some scripts failed), maintaining settings after a server was replaced...). Also the database collectiong all the records tiself needs maintenance and performance tuning, so additional work comes up ti keep the data useful...

What is finally completely missing is the ability to look at things that happen live. If, I am able to tell what was possibly going on the next day after the data collectors have ran. Also all the details are missing. I do not have access to deadlock graphs, I can't look at query plans of queries that were running in a suspicious timeframe....

All of that made me going to charge management to spend money for a prefessional solution I am not able to create on my own.

The final choice was to buy SentryOne because in comparison to others it is convincing and delivers a lot of information required to identify our pain points.

As a final conclusion I would advice anyone looking for answers to similar question not to try creating things on their own as long as you don't have a small and basically healthy environment in place. If you have couple of systems and a lot of problems, better immedeately go for a professional solution immediately and use the assistence of the vendor on your problems instead of spending a lot of time and money to create somehing less useful.

I hope you find this useful once you ran into this question thread.

More than one year later I want to let everyone know my experience and the final result of this question / topic.

I started out creating things on my own. Initially I followed the Article Collect and store historical SQL Server performance counter data with CMVs of Tim Ford to get something up and extended this with whatever Data I wanted to collect. So one a day I run several stored procedures on each Sql Server that collect some specific information from DMVs and stores the results on the local Server inside of a database. This includes index usage, missing indexes, specific log entries like autogrow, server settings, application database settings, fragmentation, job execution, transaction log info, file information, wait stats and more.

Additionally I added Brent Ozar's sp_blitz regulary execution results to this repository to collect additional valuable indcications to work, improve and report.

All data is lateron collected from there into a dedicated monitoring Sql Server and this way I create a bundeled store for performance relevant information about all my servers and use this a a base for investigation and reporting.

Then I created excel sheets and also reports using reporting services to analyze and interpret. Some samples:

enter image description here enter image description here enter image description here

Also I configured some performance counters monitoring using TYPEPERF inspired by the article "Collecting Performance Data into a SQL Server Table" by Fedor Georgiev.

From my SQL Monitoring instance I trigger typeperf to run and collect a configurable number of samples with a configurable sampleinterval and store the results in my central monitoring db.

This allows me to observer longterm performance values, sample:

enter image description here

After a while of using this to gather baseline information, it tunred out that it is quite a lot of maintenance work that has to be spent on looking at failed jobs, de-buggin procedures (for example in case a DB was taken offline, some scripts failed), maintaining settings after a server was replaced...). Also the database collectiong all the records tiself needs maintenance and performance tuning, so additional work comes up ti keep the data useful...

What is finally completely missing is the ability to look at things that happen live. If, I am able to tell what was possibly going on the next day after the data collectors have ran. Also all the details are missing. I do not have access to deadlock graphs, I can't look at query plans of queries that were running in a suspicious timeframe....

All of that made me going to charge management to spend money for a prefessional solution I am not able to create on my own.

The final choice was to buy SentryOne because in comparison to others it is convincing and delivers a lot of information required to identify our pain points.

As a final conclusion I would advice anyone looking for answers to similar question not to try creating things on their own as long as you don't have a small and basically healthy environment in place. If you have couple of systems and a lot of problems, better immedeately go for a professional solution immediately and use the assistence of the vendor on your problems instead of spending a lot of time and money to create somehing less useful.

I hope you find this useful once you ran into this question thread.

Source Link
Magier
  • 4.8k
  • 8
  • 47
  • 89
Loading