Added response to comment
Source Link
Paul White
  • 90.3k
  • 30
  • 424
  • 663

From the execution plans provided, for the COUNT case the optimizer chooses a local/global aggregation strategy around the final join:

Final join

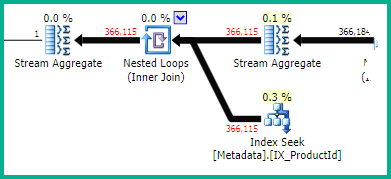
Unfortunately, the optimizer overestimates the effectiveness of the local aggregation. It estimates 136 rows driving the Nested Loops join, whereas 366,115 are encountered at runtime.

Estimates

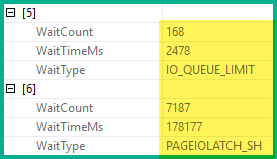
The 366,115 index lookups might not be too much of an issue for a local SQL Server instance, but the wait stats included in the plan show the I/O (and possibly memory) limitations of your current Azure SQL Database configuration:

Wait stats

The plan for SELECT 1 shows an exclusively hash and merge join strategy, which produces better results in this case with the very limited memory and/or I/O capabilities.

You might well see better performance for the first query with an OPTION (HASH JOIN, MERGE JOIN) hint, but the fundamental issue is the poor cardinality/data distribution estimate driven by the large number of joins.

Don't be misled by the cost percentages shown against each plan operator - these numbers are currently derived from the optimizer's estimate of cost (using an abstract model). The numbers do not reflect runtime conditions or costs.

Large deviations between estimated and actual row counts can often lead to problems. This is especially true for an underestimate that causes the optimizer to choose a strategy that does not scale up well on a particular hardware setup.

From the execution plans provided, for the COUNT case the optimizer chooses a local/global aggregation strategy around the final join:

Final join

Unfortunately, the optimizer overestimates the effectiveness of the local aggregation. It estimates 136 rows driving the Nested Loops join, whereas 366,115 are encountered at runtime.

Estimates

The 366,115 index lookups might not be too much of an issue for a local SQL Server instance, but the wait stats included in the plan show the I/O (and possibly memory) limitations of your current Azure SQL Database configuration:

Wait stats

The plan for SELECT 1 shows an exclusively hash and merge join strategy, which produces better results in this case with the very limited memory and/or I/O capabilities.

You might well see better performance for the first query with an OPTION (HASH JOIN, MERGE JOIN) hint, but the fundamental issue is the poor cardinality/data distribution estimate driven by the large number of joins.

Don't be misled by the cost percentages shown against each plan operator - these numbers are currently derived from the optimizer's estimate of cost (using an abstract model). The numbers do not reflect runtime conditions or costs.

Large deviations between estimated and actual row counts can often lead to problems. This is especially true for an underestimate that causes the optimizer to choose a strategy that does not scale up well on a particular hardware setup.

Added link
Source Link
Paul White
  • 90.3k
  • 30
  • 424
  • 663

From the execution plans provided, for the COUNT case the optimizer chooses a local/globallocal/global aggregation strategy around the final join:

Final join

Unfortunately, the optimizer overestimates the effectiveness of the local aggregation. It estimates 136 rows driving the Nested Loops join, whereas 366,115 are encountered at runtime.

Estimates

The 366,115 index lookups might not be too much of an issue for a local SQL Server instance, but the wait stats included in the plan show the I/O (and possibly memory) limitations of your current Azure SQL Database configuration:

Wait stats

The plan for SELECT 1 shows an exclusively hash and merge join strategy, which produces better results in this case with the very limited memory and/or I/O capabilities.

You might well see better performance for the first query with an OPTION (HASH JOIN, MERGE JOIN) hint, but the fundamental issue is the poor cardinality/data distribution estimate driven by the large number of joins.

From the execution plans provided, for the COUNT case the optimizer chooses a local/global aggregation strategy around the final join:

Final join

Unfortunately, the optimizer overestimates the effectiveness of the local aggregation. It estimates 136 rows driving the Nested Loops join, whereas 366,115 are encountered at runtime.

Estimates

The 366,115 index lookups might not be too much of an issue for a local SQL Server instance, but the wait stats included in the plan show the I/O (and possibly memory) limitations of your current Azure SQL Database configuration:

Wait stats

The plan for SELECT 1 shows an exclusively hash and merge join strategy, which produces better results in this case with the very limited memory and/or I/O capabilities.

You might well see better performance for the first query with an OPTION (HASH JOIN, MERGE JOIN) hint, but the fundamental issue is the poor cardinality/data distribution estimate driven by the large number of joins.

Source Link
Paul White
  • 90.3k
  • 30
  • 424
  • 663

From the execution plans provided, for the COUNT case the optimizer chooses a local/global aggregation strategy around the final join:

Final join

Unfortunately, the optimizer overestimates the effectiveness of the local aggregation. It estimates 136 rows driving the Nested Loops join, whereas 366,115 are encountered at runtime.

Estimates

The 366,115 index lookups might not be too much of an issue for a local SQL Server instance, but the wait stats included in the plan show the I/O (and possibly memory) limitations of your current Azure SQL Database configuration:

Wait stats

The plan for SELECT 1 shows an exclusively hash and merge join strategy, which produces better results in this case with the very limited memory and/or I/O capabilities.

You might well see better performance for the first query with an OPTION (HASH JOIN, MERGE JOIN) hint, but the fundamental issue is the poor cardinality/data distribution estimate driven by the large number of joins.