3

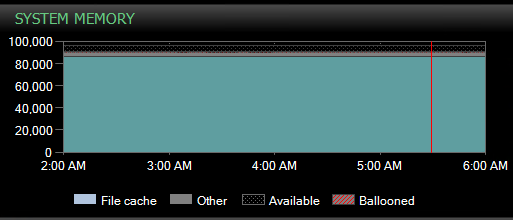
We have been battling an issue with weird memory pressure on a specific server for a couple of months now. Here's what the last incident looked like in SentryOne:

System Memory

System Memory

SQL Server Memory

SQL Server Memory

Memory Configuration:

  • Total Server Memory - 96GB
  • Max Server Memory - 84GB

The reason why this seems weird is that, if it were external memory pressure I'd expect the Other category on System Memory to grow during this, which is doesn't.

Part of what we see happen during this time is that queries end up generating bad plans and end up causing performance issues for the app. Historically, running DBCC FreeProcCache during this situation has alleviated the pressure, but we still don't know the cause. I think the plans getting a bad plan is a symptom rather than a cause of this issue, but I may be wrong.

Things that we have done to try and resolve this issue:

  • Removed a join in what we thought was the problematic sp
  • Deleted duplicate records in the database
  • Increased memory on the server (I think we added 16-32 gb)
  • Enabled Lock Pages In Memory

I am at a complete loss as to what to look at next. Our architect thinks we might need to fiddle with some VM settings with memory, but we aren't there yet.

What can I look at to potentially fix this weird memory pressure issue?

5
  • 1
    Might not be the same issue, but the steps here might help with troubleshooting.
    – Jacob H
    Commented Feb 26, 2020 at 21:01
  • @JacobH that's a mighty deep rabbit hole, but i am going to monitor the size of our TokenAndPermUserStore
    – DForck42
    Commented Feb 26, 2020 at 22:03
  • Maybe not that specific cache bucket, but the query might help you determine if you have a caching problem. Or at least give you another place to look when you start seeing the problem. Are you noticing your plan cache being evicted or churning a lot when it happens? That could potentially be the cause of your frequent bad plan generation.
    – Jacob H
    Commented Feb 27, 2020 at 0:40
  • @JacobH typically when this happens we see the plan cache drop significantly.
    – DForck42
    Commented Feb 27, 2020 at 14:45
  • 1
    That's very similar to the behavior we saw. Reboot server (or clear cache otherwise) then over the next few days the plan cache started to "shrink" and get volatile until CPU spiked as plans were being recreated constantly. The vendor had us rebooting weekly. It appears that SQL Server uses 90% of the cache for data pages, and the other 10% for all other caching (plans and all else). If it's not tokens, maybe check and see if any of the other buckets look odd? Keeping in mind that that 8.4 GB on your server is the shared limit for non data caches. The query on my linked post might help you.
    – Jacob H
    Commented Feb 27, 2020 at 15:34

3 Answers 3

3

There is a cool article by Jonathan Kehayias on SQL SQLSkills.com with the title Wow… An online calculator to misconfigure your SQL Server memory!.

In his article Jonathan writes:

My general recommendation is to use the calculation from my book, Troubleshooting SQL Server: A Guide for the Accidental DBA, which is to reserve 1 GB of RAM for the OS, 1 GB for each 4 GB of RAM installed from 4–16 GB, and then 1 GB for every 8 GB RAM installed above 16 GB RAM. This isn’t an overly technical calculation but it has worked well and is generally going to configure ‘max server memory’ low enough that the server will be stable and have reliable performance.

If you follow on with this example, then you might be better off with configuring your SQL Server to run with a max_memory setting of 81 GB.

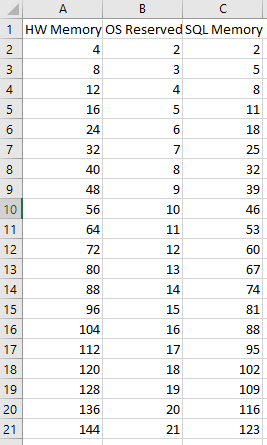
You can create an Excel to produce a nice little graph of SQL Server Max Memory settings with the following formulas and data.

Sample Data for SQL Server Memory Calculation

The Excel Sheet starts of with a HW Memory (A2) column:

4

The Excel formula for the second column OS Reserved (B2) is:

IF(A2<=16;1 + A2/4;1+4+(A2-16)/8)

The SQL Memory column (C2) is then:

A1-A2

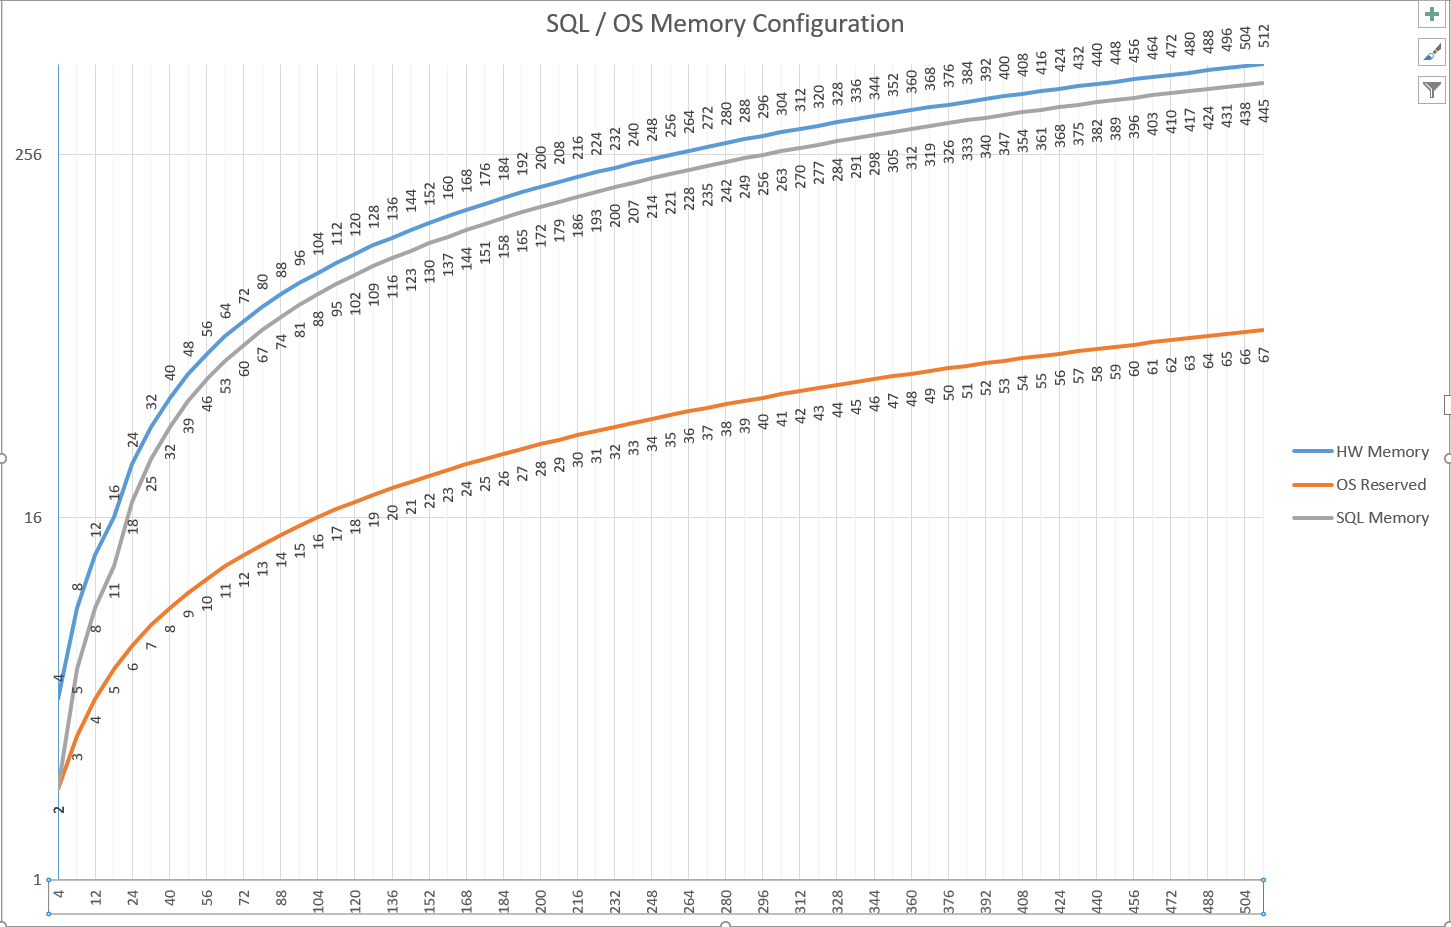
This produces the following chart:

SQL Server Memory Configuration Chart

Possible Solution

As you can see, if you have 96 GB of RAM, then you should reserve 15 GB for the OS and set the SQL Memory (max_memory) to 81 GB.

Jonathan goes on to explain in his article that ...

SQL Server has a built-in component of the SQLOS, the Resource Monitor, that monitors the QueryMemoryResourceNotification Windows Server API to get status about the OS level memory availability on the server. If the Windows OS is under memory pressure, it will set a low memory notification that the Resource Monitor thread will detect and force the external clock hands on the caches internally to begin sweeps of the caches to cleanup and reduce memory usage allowing the process to free memory back to the OS.

Your OS might not have enough memory and is taking the memory away from the SQL Server OS.

Slightly reducing your max_memory setting to 81 GB will allow the OS and other SQL Server components that don't run inside the max_memory setting to have enough RAM.

Your mileage may vary

1
  • 1
    we ended up doing two things: enabling optimize for ad hoc workload, and gave the os a bit more memory. we haven't seen any issues since 2/26, which seems very promising. however, historically we have gone almost a month between issues so we will continue to monitor
    – DForck42
    Commented Mar 6, 2020 at 13:51
2

I may be wrong about this, but let's try anyway. Maybe it will be helpful to you.

From screenshot you provide it seems the page life expectancy tanks, when you start having performance problems. I presume you see queries having long PAGEIOLATCH_* waits at that time? You also mention bad plans are being generated and running DBCC FREEPROCCACHE fixes the problem temporarily. To me it sounds like typical symptoms of parameter sniffing. I would guess you have one query, which, when compiled with wrong parameters, does table scan instead of seek, uses wrong index or the shape of the query plan changes. Generally this is a query which requires plenty of I/O and saturates storage subsystem so even simple queries doing key lookups become slow. I would try to identify which one is it and confirm by removing only its plan, when you have performance problems.

To identify the problematic query I would just look at those which have long PAGEIOLATCH waits and compare their execution plans when they are quick.

To fix it you need to get creative. You could try adding query hints, forcing recompile on every execution, use plan guides. I also had success with changing indexes on the underlying tables and rewriting problematic queries. It's hard to advise anything specific, since your problem right now is to identify what is causing your problems.

0

I've seen similar issues when running nightly SSIS jobs, sometimes SSIS memory usage is invisible to Sentryone for whatever reason. I'd have a look in the event calendar in S1 to see what jobs are running at the time.

1
  • We're not running SSIS on this box
    – DForck42
    Commented Feb 28, 2020 at 14:09

Your Answer

By clicking “Post Your Answer”, you agree to our terms of service and acknowledge you have read our privacy policy.

Not the answer you're looking for? Browse other questions tagged or ask your own question.