0

I am running PostgreSQL 13, and single UPDATE statement that seems like it would be trivial to complete can take hours (at least in one case more than 24 hours).

Selecting the rows with a SELECT statement takes under a second. Updating the rows is drastically slower, within only 30000 rows affected.

The column in question that I am trying to update is not indexed. The database is also well-provisioned for the scale of the database. While the query is active, I can see 1 of the 4 vCPU at full throttle. Memory settings are tuned to typical defaults recommended for a 32GB RAM system.

After the first execution, I can flip the boolean archived column back & forth much more quickly (5 minutes first UPDATE -> 15 seconds to do inverse in my simulated case).

There are some properties that make this table unique. The schema of the DB is highly normalized. This table holds the names and uuids for many of the data models, so there are many FK relationships. The table has 16 columns, with 10 indexes and 4 constraints. The updated column value is not part of a constraint or an index.

Why is performance for this update query so poor? Is there anything I can do to improve the performance?

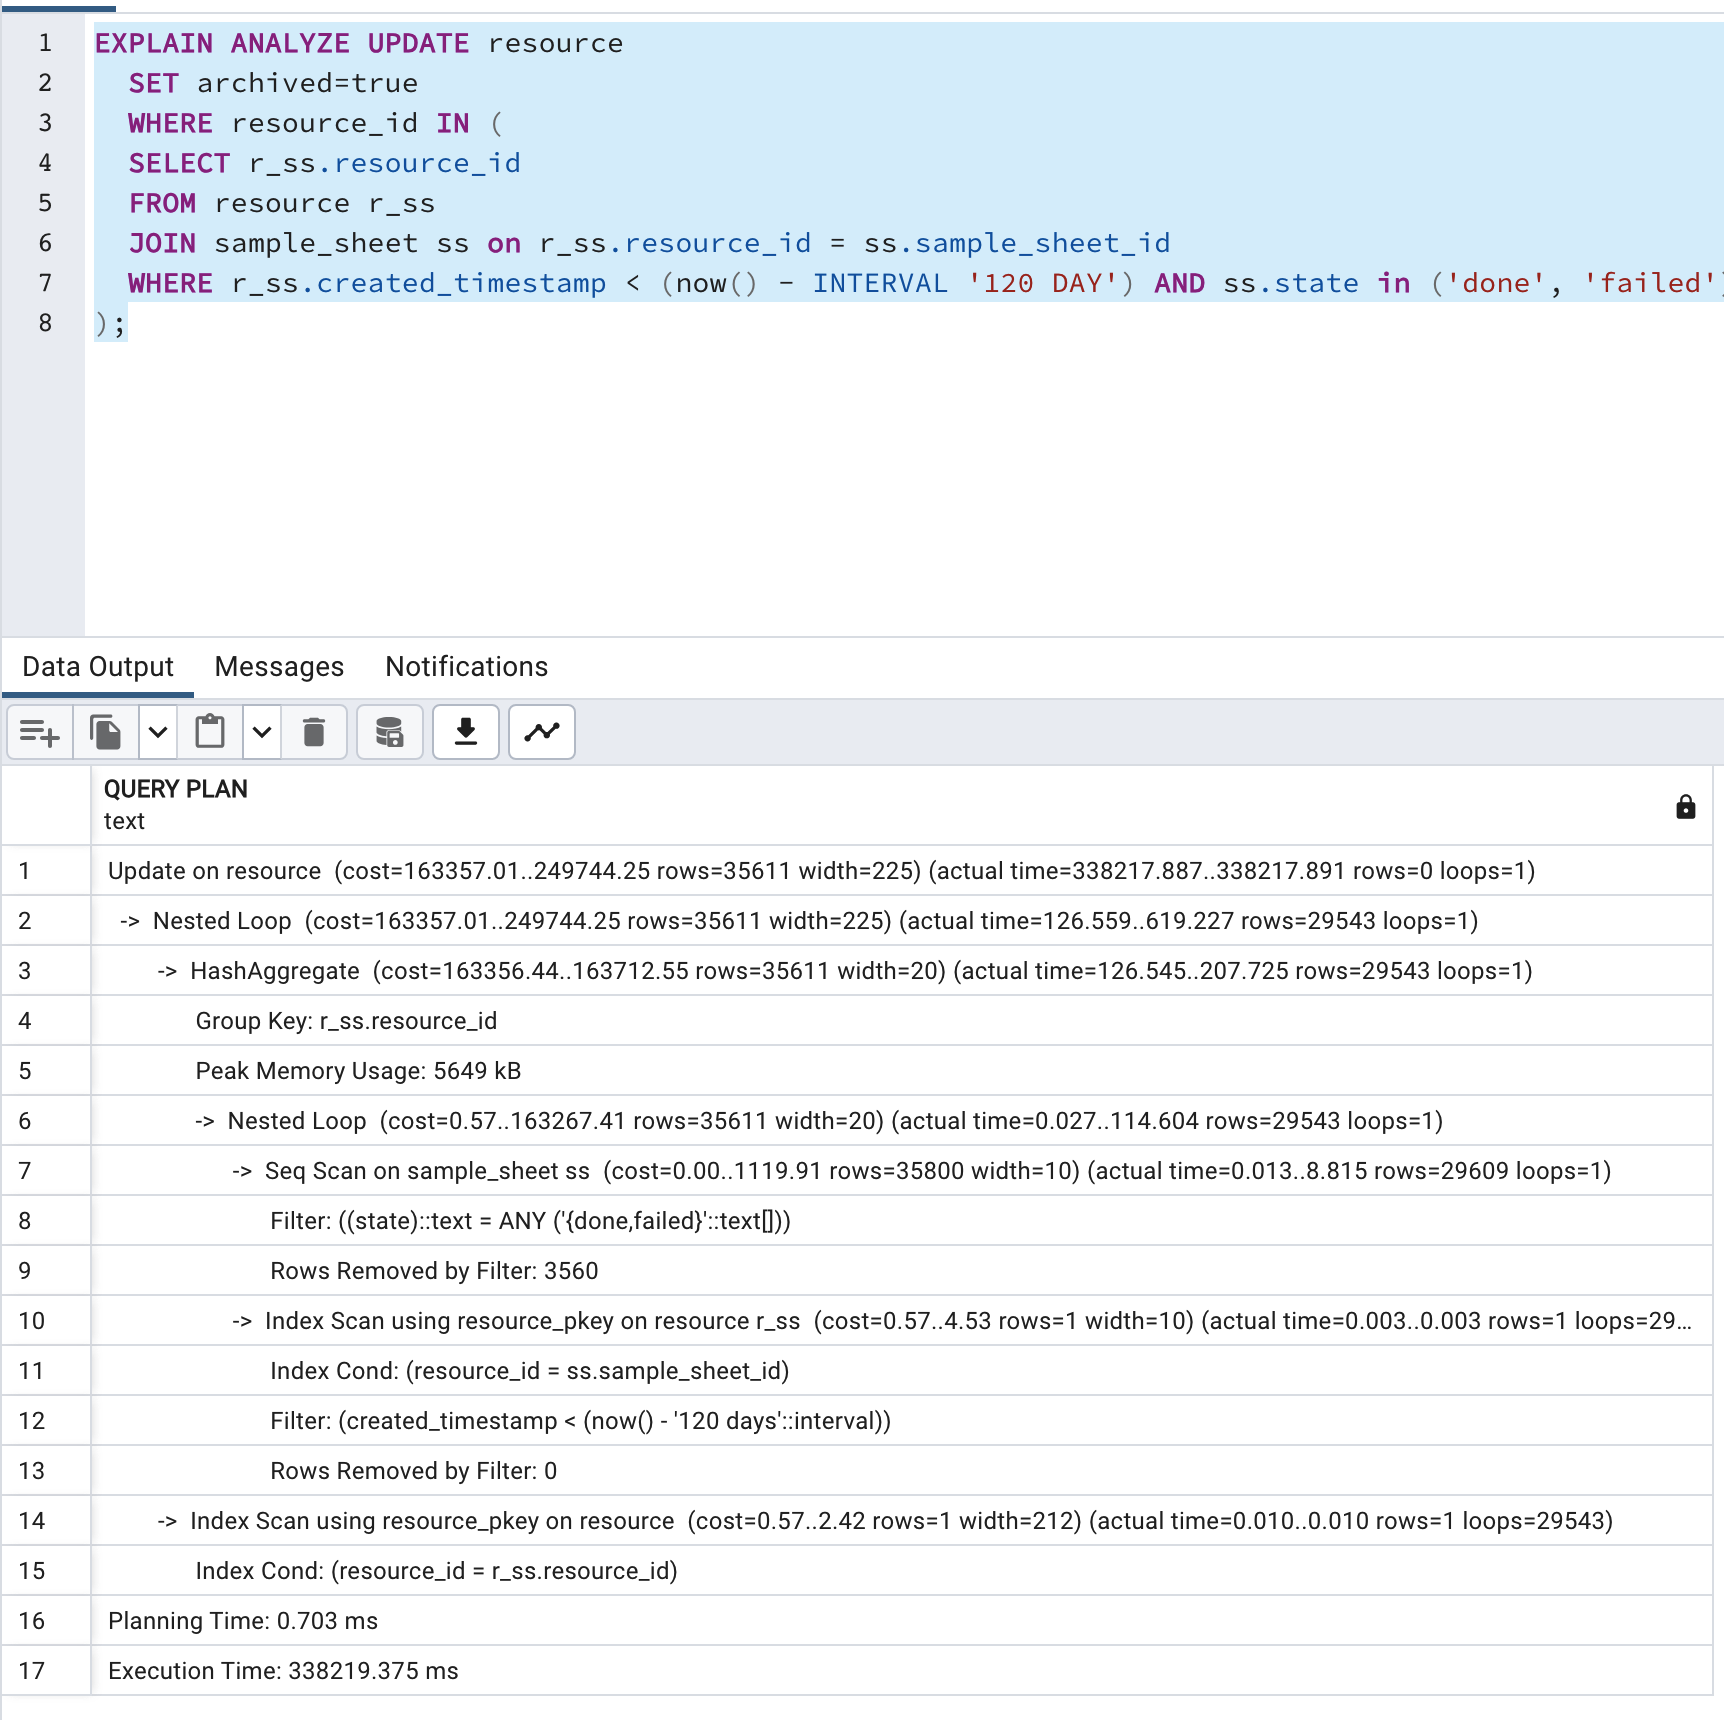
Query Plan

5
  • 1
    Are there any lock waits?
    – mustaccio
    Commented Dec 12, 2023 at 23:20
  • No I checked for locks in the system where it was first created. This was the longest duration query, but it left a lot of locks in its wake (blocked queries coming in behind it). I ran a "blocking query" lookup and this query was the oldest query blocking others, but not in itself blocked. Running this in isolation in a test system in Azure, it is still takes up to 30 minutes for updating ~30000 records. IOPS does not seem capped, and reported wait event types appear to be CPU bound. Commented Dec 13, 2023 at 16:40
  • 1
    Has this table been vacuum'd recently? Also it is about 10 milliseconds per row which is suspiciously close to a harddisk's random access time. If it had to write 30k pages at random places in the table on a spinning disk, that would definitely take a while, but normally the query would return quickly while that's done in the background or at the next checkpoint... Is it a SSD? Was the CPU that was pegged at 100% used by postgres, or by another process, or the OS?
    – bobflux
    Commented Dec 13, 2023 at 18:26
  • The test system that took 30 minutes is a 1TB Premium SSD on Azure. P30 tier - 5000 iops. Using a memory optimized 4 vCore, 32GB RAM, 6400 max IOPS compute. (Standard_E4s_v3). No replication - just a single machine. The other environment that was running in AWS Aurora was over 24 hours. AWS Aurora has built in replication (I think 6 replicas, plus its not using standard WAL). It is managed PostgreSQL - I assume the full core was used by PostgreSQL, but I don't know the process name due to lack of shell access. Commented Dec 13, 2023 at 22:39
  • The first run looks to be CPU bound 1 core, IOPS was much lower around 50-100 IOPS. The second run doing the inverse operation on the test system - the IOPS are much higher around 300-400 with much less CPU (not even a full core). This is off Azure metrics. As for vacuuming, we have only been relying on auto vacuuming. Our DB mostly only performs INSERTs, never deletes, rarely UPDATEs. (dead rows may be small) Commented Dec 13, 2023 at 22:50

2 Answers 2

1

The statement could be rewritten to the simpler

UPDATE resource AS r
SET archived = TRUE
FROM sample_sheet AS ss
WHERE r.resource_id = ss.sample_sheet_id
  AND r.created_timestamp < current_timestamp - INTERVAL '120 00:00:00'
  AND ss.state IN ('done', 'failed');

But that won't help your performance. All the time is spent in the actual update. Apart from a really, really slow disk, possible causes could be

  • locks that block execution of the update

  • excessively many indexes on the table (and perhaps slow ones like GIN indexes)

  • a trigger can be ruled out, because that should show up in EXPLAIN (ANALYZE) output

I would set track_io_timing = on and retry the query with EXPLAIN (ANALYZE, BUFFERS, WAL) for more detailed information.

6
  • Thanks again for your response Laurenz! I checked locks, and this was the oldest query in pg_stat_activity. In the resource table and joined sample_sheet table we only have BTree indexes. Rerunning the query to flip back & forth between True/False no longer reproduces the timing. (Some kind of buffer/opti?) explain.dalibo.com/plan/8285d6a977ag409e We have 12 btrees on this table, some of which are unique, one multiindex, 1 on lower(name::text)) with a WHERE clause. There is 1 check constraint against 2 integer columns. 1 FK constraint, but also ~100 FK references to other tables Commented Dec 13, 2023 at 16:54
  • No clue. But if you cannot reproduce it it is hard to debug. Commented Dec 13, 2023 at 22:19
  • Reproducible on a very small dataset. explain.dalibo.com/plan/46476ec39f8cd7c7 We flip the archive flag for 1415 rows in a 200,000 row resource table. That operation took 9 minutes. "Buffers hit" is huge (TB), but I don't understand why. Fill factor is default for everything. Vacuum settings are all default. This is slightly different hardware --- running PostgreSQL 13 inside a Docker container colocated with the application (application idle, except for this PgAdmin executed query). Commented Dec 14, 2023 at 19:33
  • Noticing a Materialize in this query plan. Perhaps the planner could not accurately estimate the # of updates that were needed and chose a plan that did not play well with the table? On a subsequent SELECT statement, a parallel seq scan is performed instead. explain.dalibo.com/plan/hg0129c5eg04db35 Commented Dec 14, 2023 at 19:39
  • Also noticing that this other test system needs the typical memory configurations updated work_mem, maintenance_work_mem, effective_cache_size, shared_buffers, temp_buffers will try it again with new settings. Commented Dec 14, 2023 at 19:53
1

After being able to reproduce the problem with several similar queries, it looks like certain forms of the UPDATE query can result in a very expensive Materialize node that loops to join the updated table's rows & columns as well as the tuple ctid for the other referenced tables.

https://explain.dalibo.com/plan/08729h152df894fd

EXPLAIN (ANALYZE, COSTS, VERBOSE, BUFFERS, FORMAT JSON)
UPDATE resource
  SET archived = true
  FROM resource r_ss
  JOIN sample_sheet ss on r_ss.resource_id = ss.sample_sheet_id
  WHERE r_ss.created_timestamp < (now() - INTERVAL '120 DAY') AND ss.state in ('done', 'failed');

A sequential scan is done on the 333 rows in sample_sheet. These are joined 1:1 with an index scan to the resource table aliased as r_ss (the resource entries for those sheets). The joined result also carries the ctid. This result (constrained by filters & index lookups) is then materialized (55,000,000 rows) and joined again to the updated table resource (no alias) in a loop. The resource table itself has 200,000 rows in this example. In this instance, the operation updated 277 rows in 2 minutes.

This form of the query does not result in the expensive materialize operations: https://explain.dalibo.com/plan/bf5377ed6d4dca95

EXPLAIN (ANALYZE, COSTS, VERBOSE, BUFFERS, FORMAT JSON)
UPDATE resource AS r_ss
  SET archived = true
  FROM sample_sheet ss
  WHERE 
  r_ss.resource_id = ss.sample_sheet_id
  AND r_ss.created_timestamp < (now() - INTERVAL '120 DAY') 
  AND ss.state in ('done', 'failed');

Verified there were no locks blocking, vacuum had minimal impact, and HOT updates had minimal impact. Worth noting that updating all 200,000 rows without any WHERE clause took ~8 seconds at 100% fill factor (only ~10% of tuple updates were HOT updates). At 50% fill factor for the table the full update took ~2 seconds with all updates being HOT. The materialize node resulting from the unnecessary join of the updated resource table and the product of resource r_ss x sample_sheet ss seemed to be the root cause.

3
  • 1
    The first one has an implicit cross join because it contains two instances of "resources" table. This is not the same problem as the query in the question.
    – bobflux
    Commented Dec 15, 2023 at 11:50
  • You're right. The queries written in my answer are different from my original question. It looks like the actual problem with the queries I was grappling with was that the cross join was not obvious (someone did not understand how to alias the updated table ("AS") , and instead joined it to itself unnecessarily). I am not sure why the revised query in my original question was taking so long to update as I had rewritten the query which incidentally fixed the cross join problem. I think most likely an issue with disk speed or bloated table for the original queryas others have suggested. Commented Dec 18, 2023 at 5:17
  • 1
    Well the plan in your question is good, so it has to be something else
    – bobflux
    Commented Dec 18, 2023 at 9:07

Your Answer

By clicking “Post Your Answer”, you agree to our terms of service and acknowledge you have read our privacy policy.

Not the answer you're looking for? Browse other questions tagged or ask your own question.