6

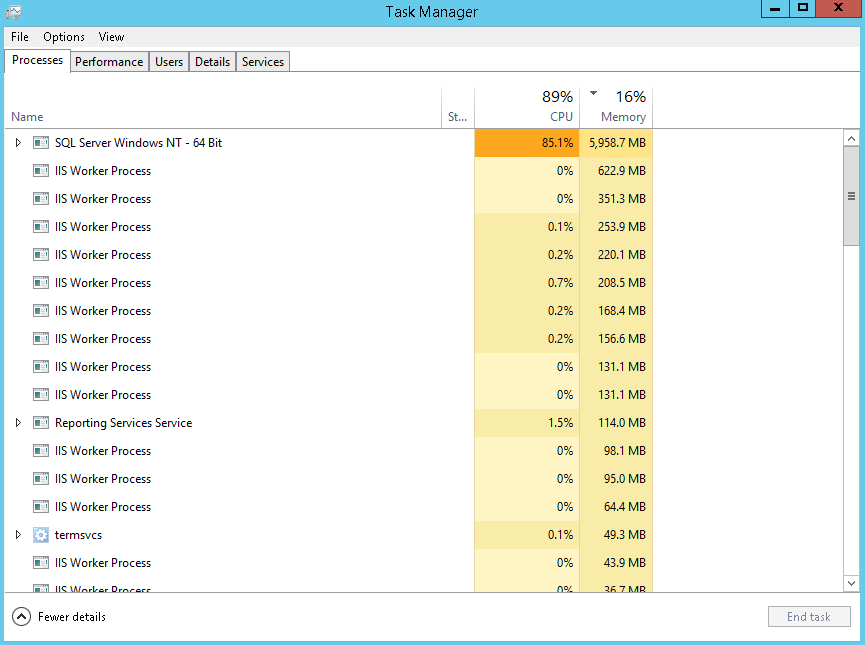
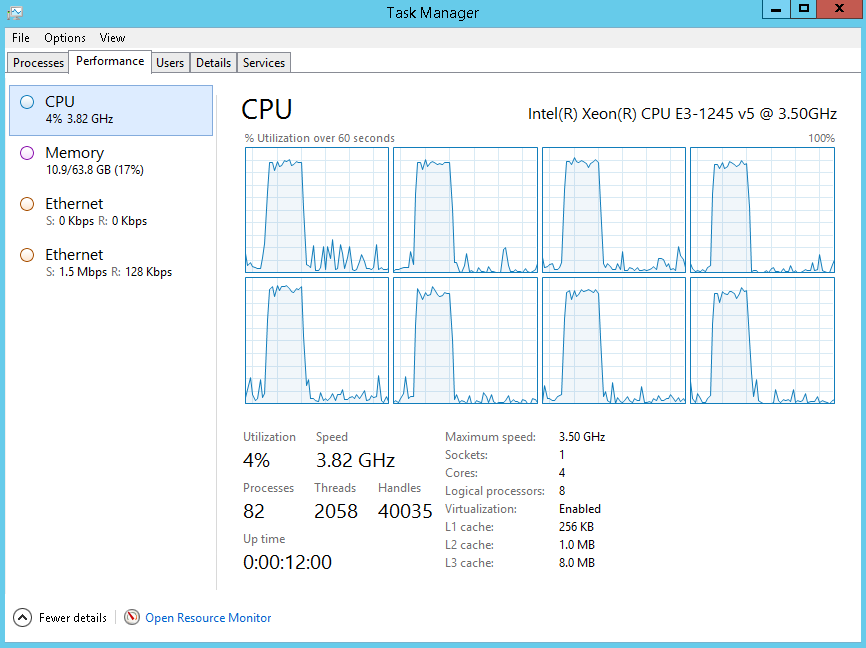
I am facing a strange behavior of my SQL Server 2016 web edition. SQL Server Windows NT 64 bit suddenly jump to use 90% of the CPU and then it goes down after 5 sec, then the spike comes again after 3 to 5 mins (normal usage is just aroud 2% to 5% of cpu)

My server specs

  • Windows Server 2012 R2 Standard Evaluation (9600 build)
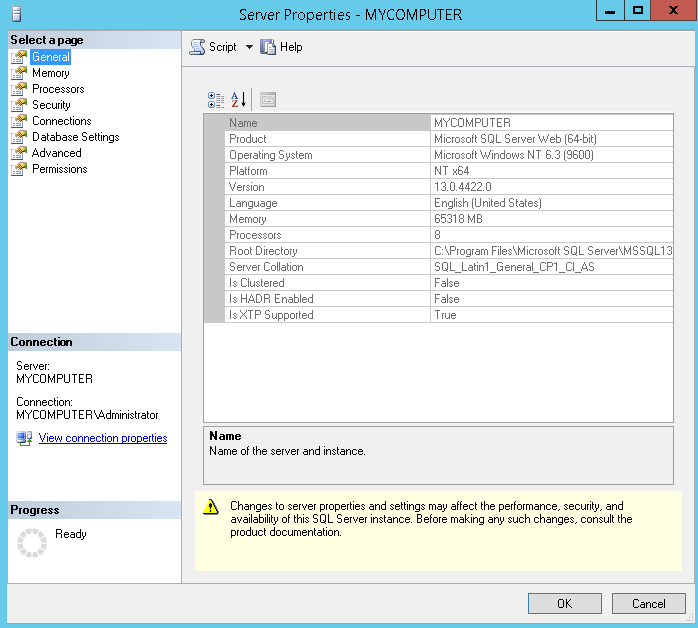
  • MS SQL Server 2016 Web
  • Intel Xeon E3-1245v5
  • 64GB DDR4 ECC (2400 MHz)
  • 3x480 GB SSD (Micron)

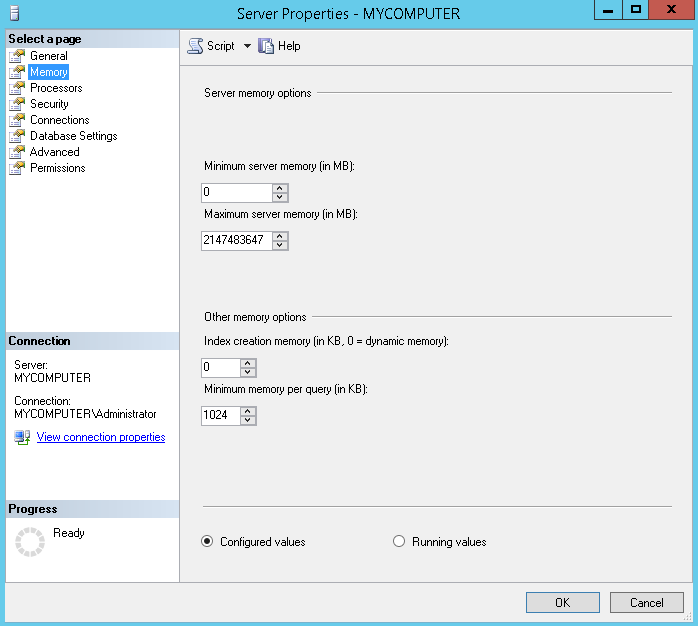
Server is up to date with latest updates installed and MS SQL Server is on default settings. How can I find what is causing this. Please help me. Thanks

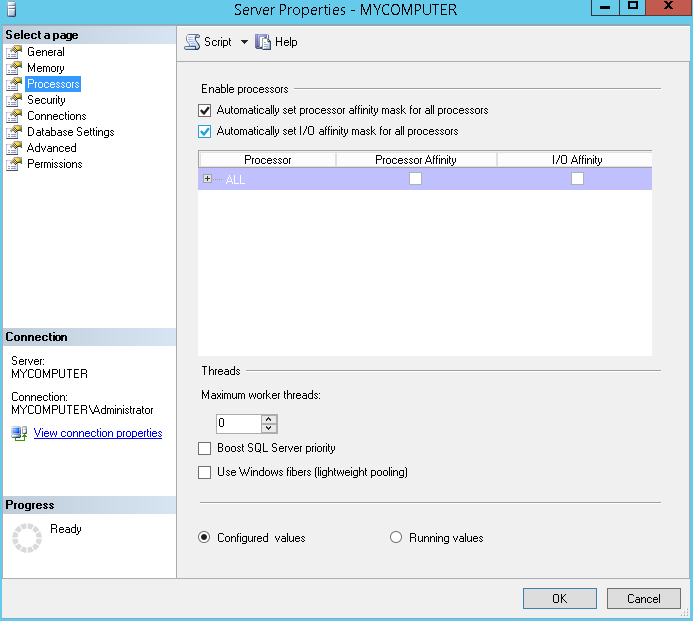
Please check the screenshots

enter image description here enter image description here enter image description here enter image description here enter image description here

5
  • 5
    Not related to your question, but I suggested you change your Maximum Server Memory (in MB) value. You can read this and this. Commented May 14, 2017 at 2:33
  • Is SQL Server the only thing running on the server aside from the operating system itself?
    – Hannah Vernon
    Commented May 14, 2017 at 4:17
  • @Sqlworldwide. How so you suggest in MBs of RAM i should allocate out of 65 GB? Please suggest me. Thanks
    – aadi1295
    Commented May 14, 2017 at 13:41
  • I would not suggest any number as it will depend on what else you are running in the same host. There are components within SQL Server that also used memory outside of that pool. I suggest you download this free e book by Jonathan Kehayias and there is a chapter on this topic. Commented May 14, 2017 at 18:22
  • 5 cron jobs also running after different time spans.. but when they trigger no spike show up. I am using quartz.net for cron jobs. Could it be the issue??
    – aadi1295
    Commented May 14, 2017 at 18:28

2 Answers 2

6

There are a few ways to approach this.

  1. Download sp_WhoIsActive and run it when you notice a CPU spike, or log it to a table and query the table looking at the CPU column (maybe ORDER BY CPU DESC).

  2. Examine the plan cache using a free script -- I co-author one called sp_BlitzCache. By default, it will return the top 10 CPU consuming queries in your server's plan cache.

  3. Buy a monitoring tool like SentryOne Performance Advisor and use it to examine your server during a spike.

0
-2

You can also start with wait stats.

use the DMV sys.dm_os_wait_stats and capture the wait stats over a period of time.

If you see very high CXPACKET waits (more than 50% than the rest of the waits) you must read this article and watch the 15 minute video by Brent Ozar.

2
  • Ok thanks for your reply. I will test it.
    – aadi1295
    Commented May 14, 2017 at 13:41
  • 2
    Wait stats could give you an idea why queries are running slowly, but most probably won't explain a CPU spike on the server. Commented May 15, 2017 at 13:46

Your Answer

By clicking “Post Your Answer”, you agree to our terms of service and acknowledge you have read our privacy policy.

Not the answer you're looking for? Browse other questions tagged or ask your own question.