We have a large database, about 1TB, running SQL Server 2014 on a powerful server. Everything worked fine for a few years. About 2 weeks ago, we did a full maintenance, which included: Install all software updates; rebuild all indexes and compact DB files. However, we did not expect that at certain stage the DB's CPU usage increased by over 100% to 150% when the actual load was the same.
After a lot of troubleshooting, we have narrowed it down to a very simple query, but we could not find a solution. The query is extremely simple:
select top 1 EventID from EventLog with (nolock) order by EventID
It always takes about 1.5 seconds! However, a similar query with "desc" always takes about 0 ms:
select top 1 EventID from EventLog with (nolock) order by EventID desc
PTable has about 500 million rows; EventID is the primary clustered index column (ordered ASC) with the data type of bigint (Identity column). There are multiple threads inserting data into the table at the top (larger EventIDs), and there is 1 thread deleting data from the bottom (smaller EventIDs).
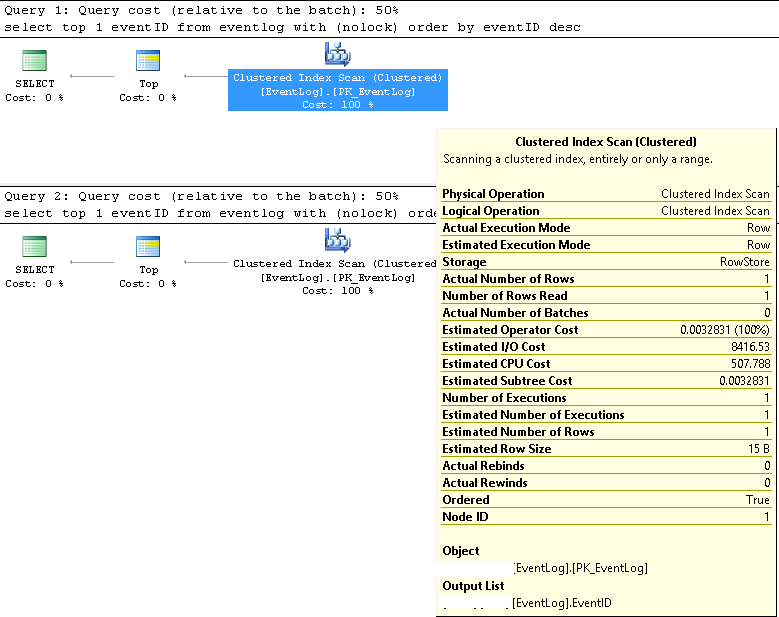
In SMSS, we verified that the two queries always use the same execution plan:
Clustered index scan;
Estimated and actual row numbers are both 1;
Estimated and actual number of executions are both 1;
Estimate I/O cost is 8500 (Seems to be high)
If run consecutively, the Query cost is the same 50% for both.
I updated index statistics with fullscan, the problem persisted; I rebuilt the index again, and the problem seemed to be gone for half a day, but came back.
I turned on IO statistics with:
set statistics io on
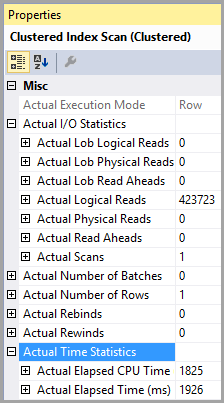
then ran the two queries consecutively and found the following info:
(For the first query, the slow one)
Table 'PTable'. Scan count 1, logical reads 407670, physical reads 0, read-ahead reads 0, lob logical reads 0, lob physical reads 0, lob read-ahead reads 0.
(For the second query, the fast one)
Table 'PTable'. Scan count 1, logical reads 4, physical reads 0, read-ahead reads 0, lob logical reads 0, lob physical reads 0, lob read-ahead reads 0.
Note the huge difference in logical reads. The index is used in both cases.
Index fragmentation could explain a little bit, but I believe the impact is very small; and the problem never happened before. Another proof is if I run a query like:
select * from EventLog with (nolock) where EventID=xxxx
Even if I set xxxx to the smallest EventIDs in the table, the query is always lightning fast.
We checked and there is no locking/blocking issue.
Note: I just tried to simplify the issue above. The "PTable" is actually "EventLog"; the PID is EventID.
I get the same result testing without the NOLOCK hint.
Can anybody help?
More detailed query execution plans in XML as follows:
https://www.brentozar.com/pastetheplan/?id=SJ3eiVnob
https://www.brentozar.com/pastetheplan/?id=r1rOjVhoZ
I don't think it matters to provide the create table statement. It is an old database and has been running perfectly fine for a long time until the maintenance. We have done a lot of research ourselves and narrowed it down to the info provided in my question.
The table was created normally with the EventID column as the primary key, which is an identity column of type bigint. At this time, I guess the problem is with the index fragmentation. Right after index rebuild, the problem seemed to be gone for half a day; but why it came back so quickly...?


