2

I am using MongoDB server version: 3.6.4 (WiredTiger storage engine) with 3 node replica set on AWS r4 large machines.

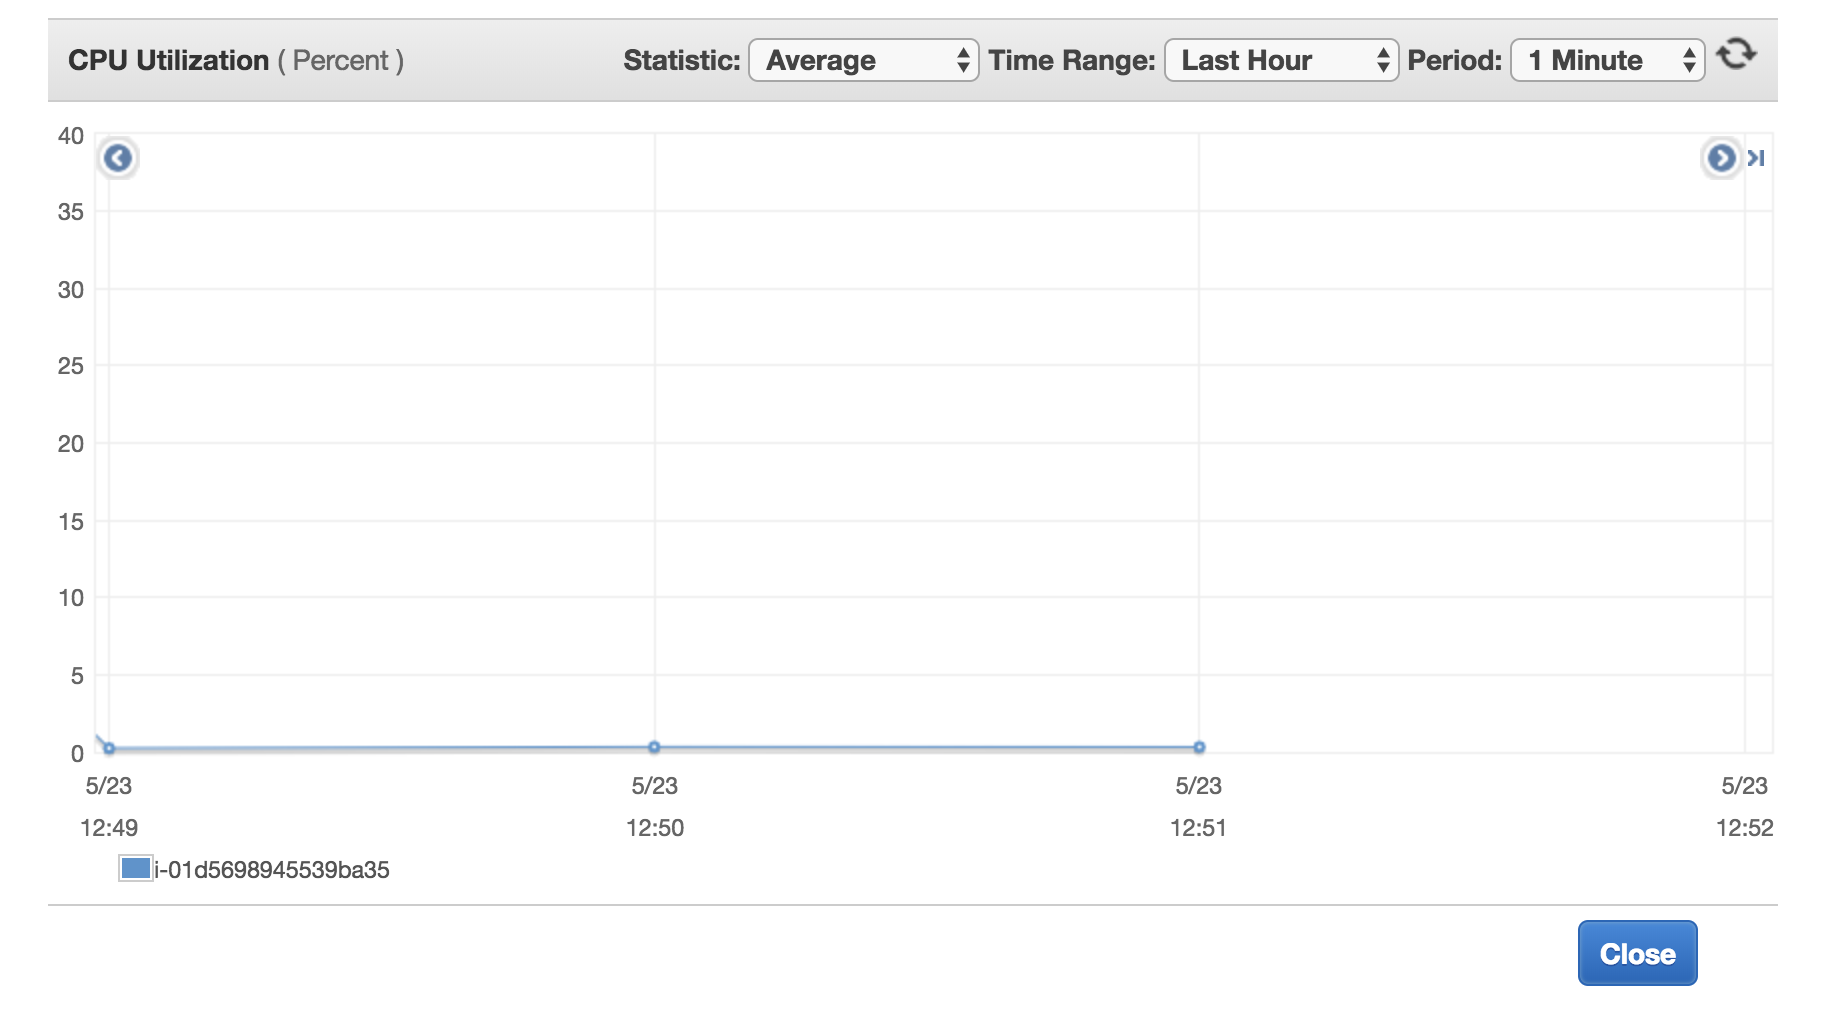
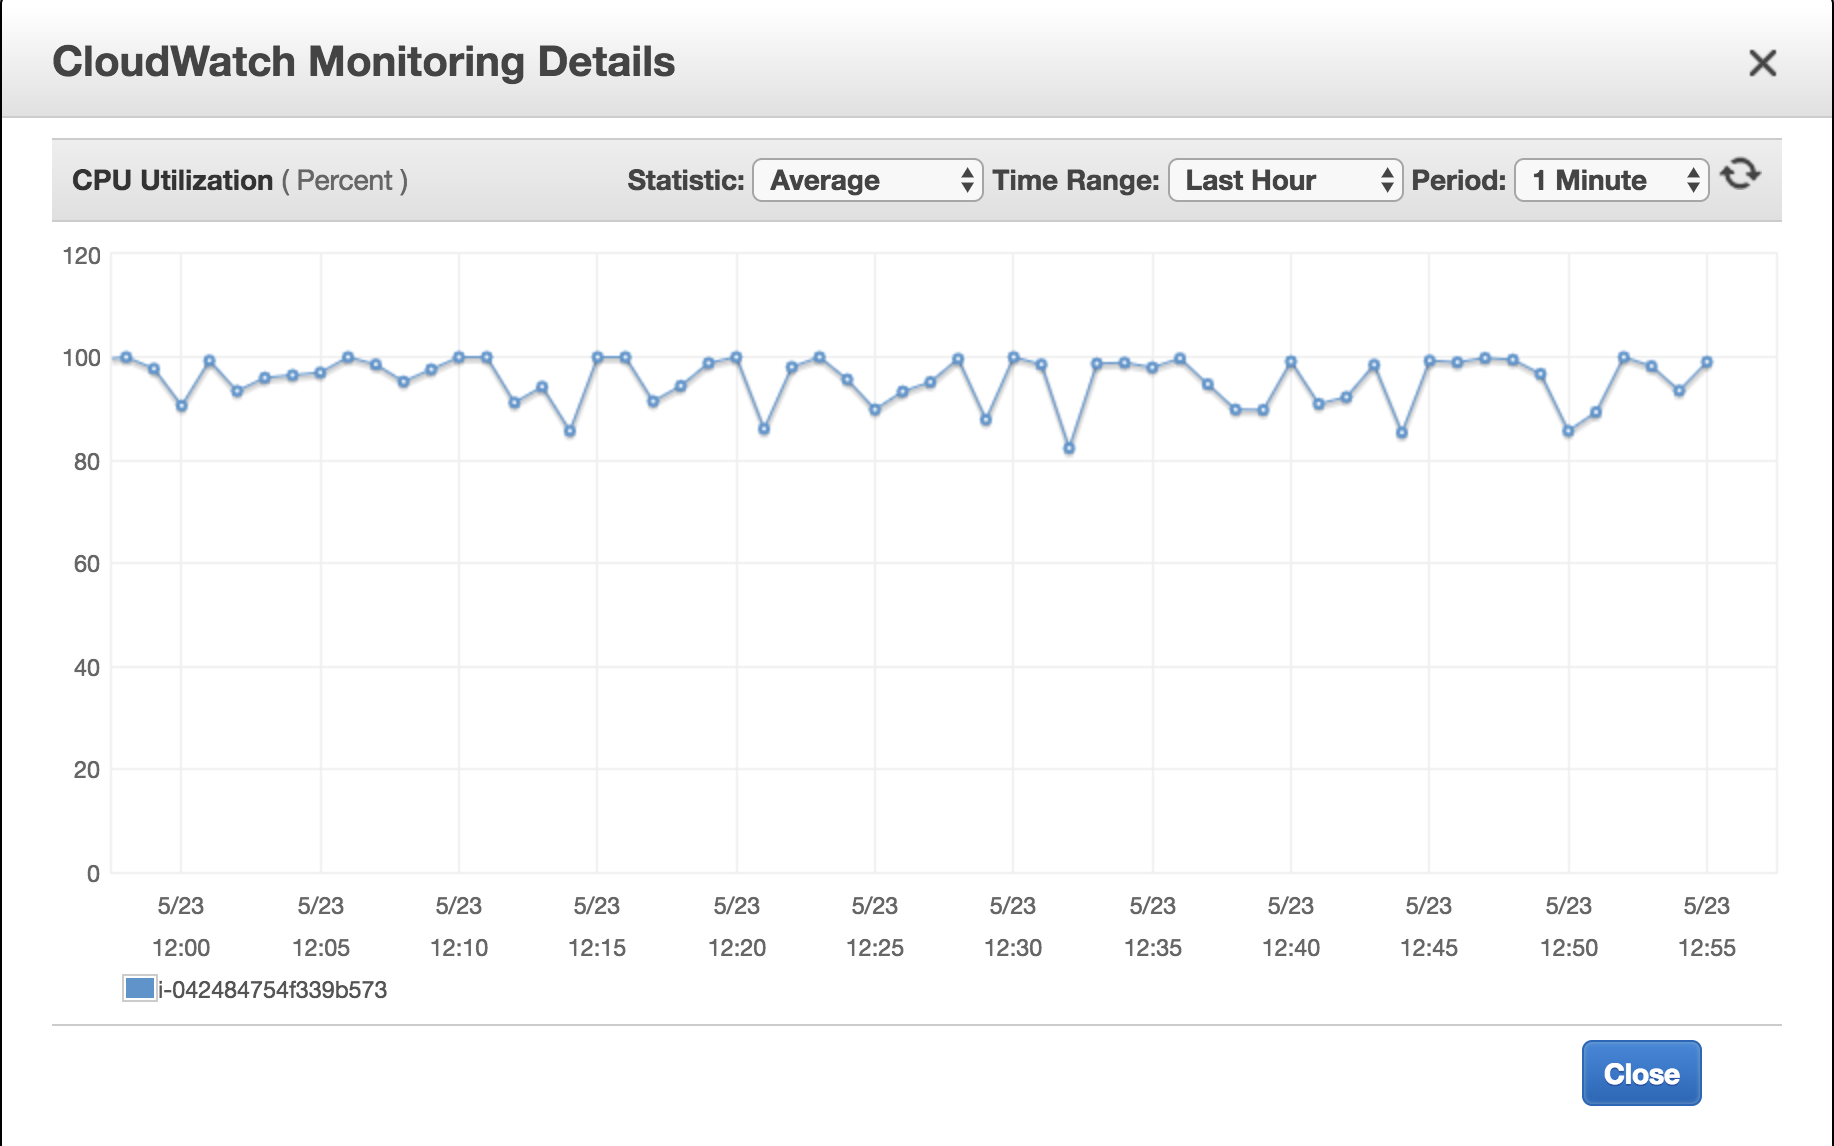
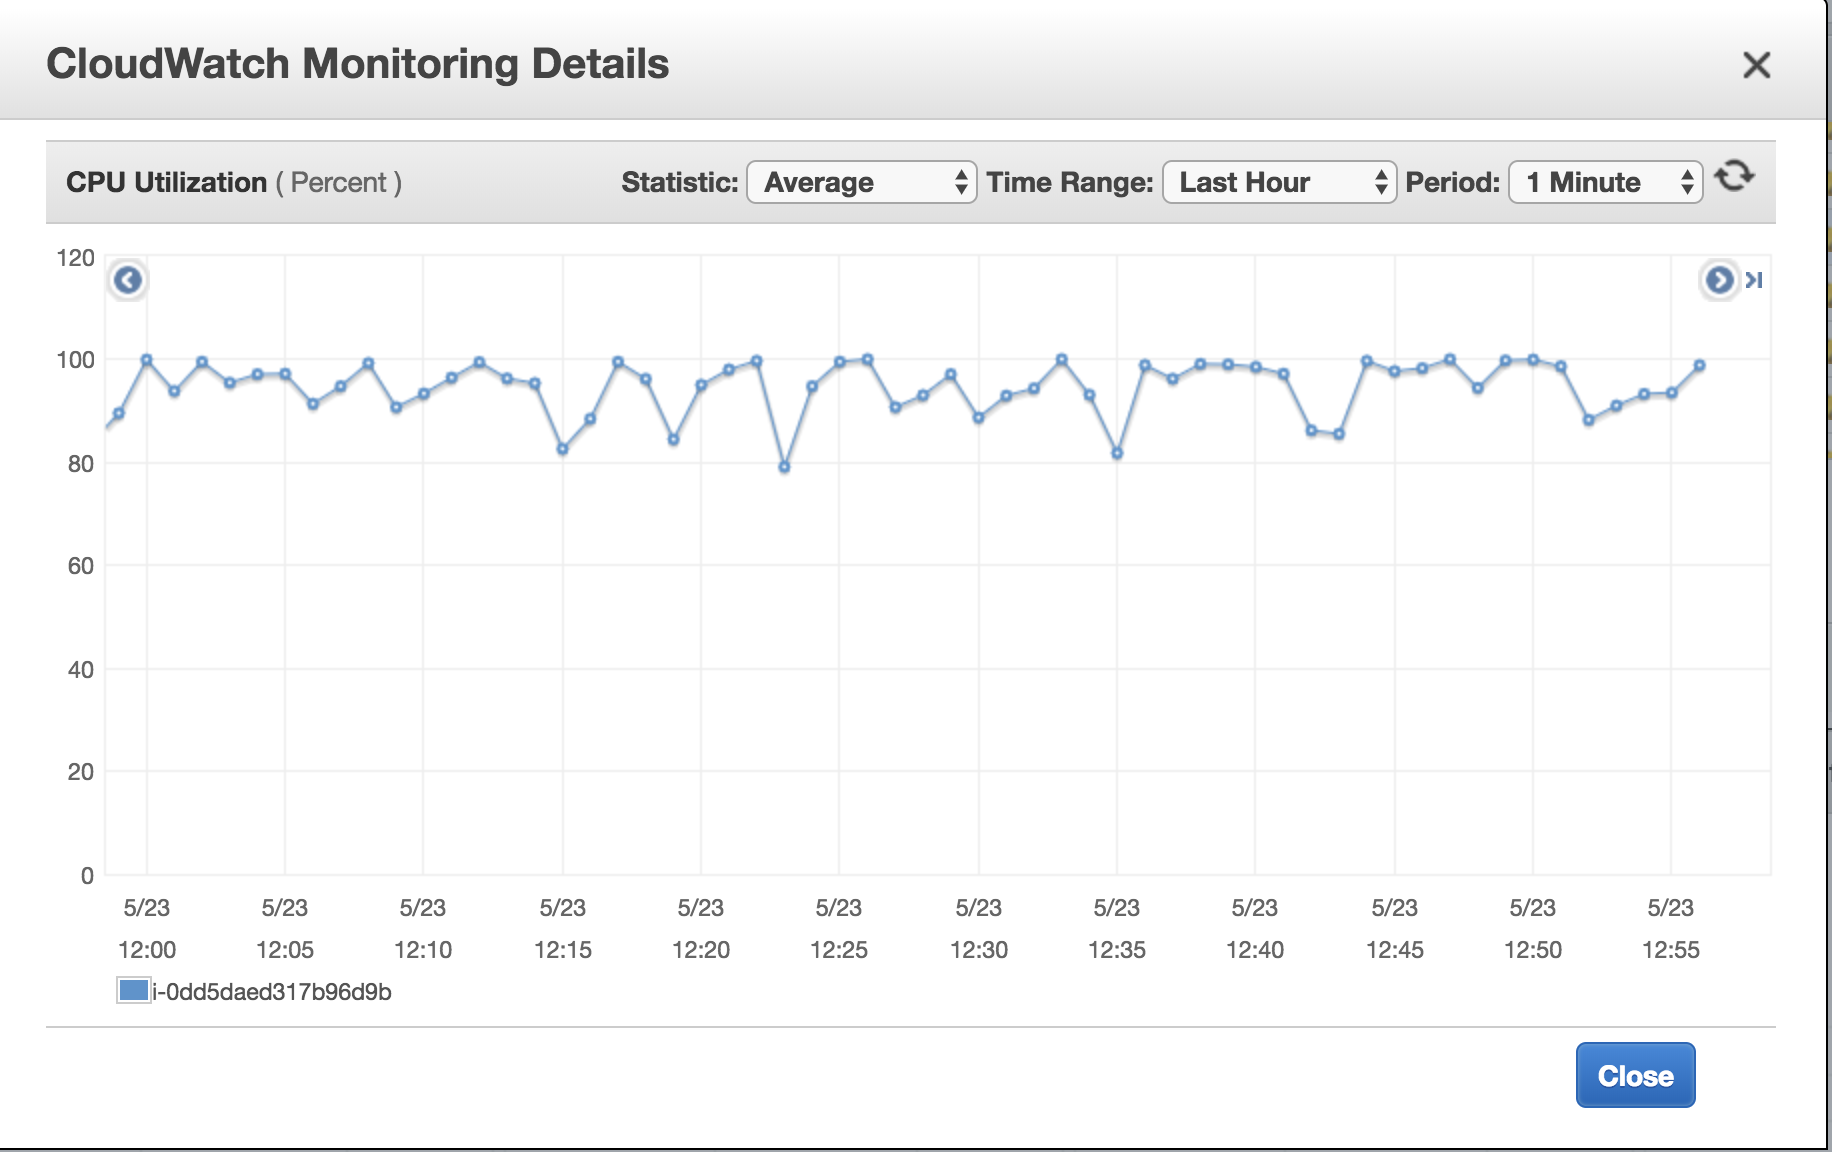
Sharing the CPU Utilization graph of all the nodes

Primary (with .33%) enter image description here

Secondary 1 (with ~99%) enter image description here

Secondary 2 (with ~99%) enter image description here

I tried to run

db.currentOp({"secs_running": {$gte: 3}})

I can see only

{
    "inprog" : [
        {
            "host" : "XXXXXXXXXXXXX",
            "desc" : "WT RecordStoreThread: local.oplog.rs",
            "active" : true,
            "currentOpTime" : "2018-05-23T12:41:42.272+0000",
            "opid" : 18,
            "secs_running" : NumberLong(16636),
            "microsecs_running" : NumberLong("16636047730"),
            "op" : "none",
            "ns" : "local.oplog.rs",
            "command" : {

            },
            "numYields" : 0,
            "locks" : {

            },
            "waitingForLock" : false,
            "lockStats" : {
                "Global" : {
                    "acquireCount" : {
                        "r" : NumberLong(1),
                        "w" : NumberLong(1)
                    }
                },
                "Database" : {
                    "acquireCount" : {
                        "w" : NumberLong(1)
                    }
                },
                "oplog" : {
                    "acquireCount" : {
                        "w" : NumberLong(1)
                    }
                }
            }
        }
    ],
    "ok" : 1,
    "operationTime" : Timestamp(1527079298, 1),
    "$clusterTime" : {
        "clusterTime" : Timestamp(1527079298, 1),
        "signature" : {
            "hash" : BinData(0,"XXXXXXXXXXXXX"),
            "keyId" : NumberLong(0)
        }
    }
}

I tried to restart the secondary machines, but after sometimes CPU utilisation reaches the peak.

I have set readPreference as secondaryPreferred

Thanks in advance

3
  • 1
    Do you have corresponding op counters for one of the secondaries to give an indication of activity? What sort of queries/commands are you sending with the secondaryPreferred read preference? High CPU could be indicative of queries that are doing work (in-memory sorts, aggregation, JavaScript evaluation) or background index builds. If you change your application read preference to the default (primary) does the CPU usage follow the workload?
    – Stennie
    Commented May 24, 2018 at 20:14
  • I have exactly the same problem, but I am using the default read preference.
    – warvariuc
    Commented Jun 16, 2018 at 8:32
  • If I restart the server it's ok for a certain period of time.
    – warvariuc
    Commented Jun 16, 2018 at 8:40

1 Answer 1

1

As per MongoDB blog documentation from Asya Kamsky here CPU load is almost never the bottleneck/limiting resource for MongoDB (or databases in general).

Unless you are running a large number of MapReduce jobs and/or aggregation framework queries, high CPU utilization tends to indicate that you have poorly tuned queries possibly with in-memory sorts (as opposed to indexes supporting sorting by reading documents in correct order).

Note: write heavy load means that rather than worrying about using available disk drive space you should be concerned about available disk IO bandwidth.

To View Metrics related to Alerts and Monitoring here. The serverStatus command returns a document that provides an overview of the database’s state. Monitoring applications can run this command at a regular interval to collect statistics about the instance.

db.runCommand( { serverStatus: 1 } )

For example, the following operation suppresses the repl, metrics and locks information in the output.

db.runCommand( { serverStatus: 1, repl: 0, metrics: 0, locks: 0 } )

Note: The output fields vary depending on the version of MongoDB, underlying operating system platform, the storage engine, and the kind of node, including mongos, mongod or replica set member.

For the serverStatus output specific to the version of your MongoDB, refer to the appropriate version of the MongoDB Manual.

And the dbStats command returns storage statistics for a given database. The command takes the following syntax:

db.runCommand({ dbStats: 1, scale: 1 })

where scale is optional and defaults to 1.

For example

> db.runCommand({ dbStats: 1, scale: 1 })
{
        "db" : "test",
        "collections" : 1,
        "views" : 0,
        "objects" : 4,
        "avgObjSize" : 86.75,
        "dataSize" : 347,
        "storageSize" : 36864,
        "numExtents" : 0,
        "indexes" : 1,
        "indexSize" : 36864,
        "fsUsedSize" : 275137204224,
        "fsTotalSize" : 499632828416,
        "ok" : 1

The scale argument allows you to specify how to scale byte values. For example, a scale value of 1024 will display the results in kilobytes rather than in bytes:

db.runCommand({ dbStats: 1, scale: 1024 })

For your further ref here and here

Your Answer

By clicking “Post Your Answer”, you agree to our terms of service and acknowledge you have read our privacy policy.

Not the answer you're looking for? Browse other questions tagged or ask your own question.