2

I have 4 identical MariaDB 10.0.33 databases that are regularly experiencing database stalls in different situations. I'm trying to understand how to tune the innodb parameters to prevent these stalls. I am aware I can/should add more ram/more disks to better support this workload. However, I really want to understand the implications innodb_lru_scan_depth has on the innodb_buffer_pool_pages_free metric, and what is causing frequent stalls as measured by the innodb_buffer_pool_wait_free metric.

First, some config:

  • Raid10 x4 SSD, 64gb ram, zero swap
  • innodb_buffer_pool_size = 48G (yes i know this can be increased a little)
  • innodb_buffer_pool_instances = 8
  • innodb_flush_log_at_trx_commit = 2
  • innodb_flush_method = O_DIRECT
  • innodb_lock_wait_timeout = 50
  • innodb_log_file_size = 4G
  • innodb_log_buffer_size = 8M
  • transaction-isolation = READ-COMMITTED
  • innodb_flush_neighbors = 0
  • innodb_io_capacity = 2000 # default 200
  • innodb_io_capacity_max = 4000 # default 2000
  • innodb_max_dirty_pages_pct_lwm = 50
  • innodb_max_dirty_pages_pct = 75
  • innodb_flushing_avg_loops=90
  • innodb_lru_scan_depth = 16384 (this is the most important)

Second, some stats:

  • Disk reads are fairly stable throughout the day at ~3k - 5k, peaks to 10k
  • Disk writes are fairly stable throughout the day at ~1k peaks to 2k
  • Disk read latency less than ~0.5ms on average, some spikes to 1ms
  • Disk write latency less than 3ms on average, some spikes to 10ms
  • Disk utilization averaging ~80% some spikes to 95-100%
  • Between 1% and 2% buffer pool cache miss ratio
  • Consistent 1k innodb pool pages flushed per sec
  • Consistent 13-18% nnodb pool bytes dirty
  • Consistent 350k - 420k pages dirty
  • Frequent drops of innodb_buffer_pool_pages_free from 130k down to 0k
  • Frequent spikes of innodb_buffer_pool_wait_free to as high as 25k

Increasing the innodb_lru_scan_depth from the default of 1024 improved the situation. innodb_buffer_pool_pages_free immediately grows every time I increase it. In the attached dashboard, I changed from a value of 16384 to 32768 innodb_lru_scan_depth at 11:40 on two of the four servers, and the pages free jumped up to ~260k from ~130k. There seems to be strong correlation between a lack of free pages, lru depth, and wait free.

My primary question is, what is the relationship between this LRU parameter and the database stalls I am experiencing?

Second question, other than adding more ram/storage bandwidth, from the database perspective, what can I tune to throttle expensive workloads that may be running in parallel, and saturating my disks? There may be a correlation with the innodb_buffer_pool_pages_old metric increasing when I'm seeing periods of database stalls. This seems to indicate something is doing a large full table scan, and making the buffer pool less optimal.

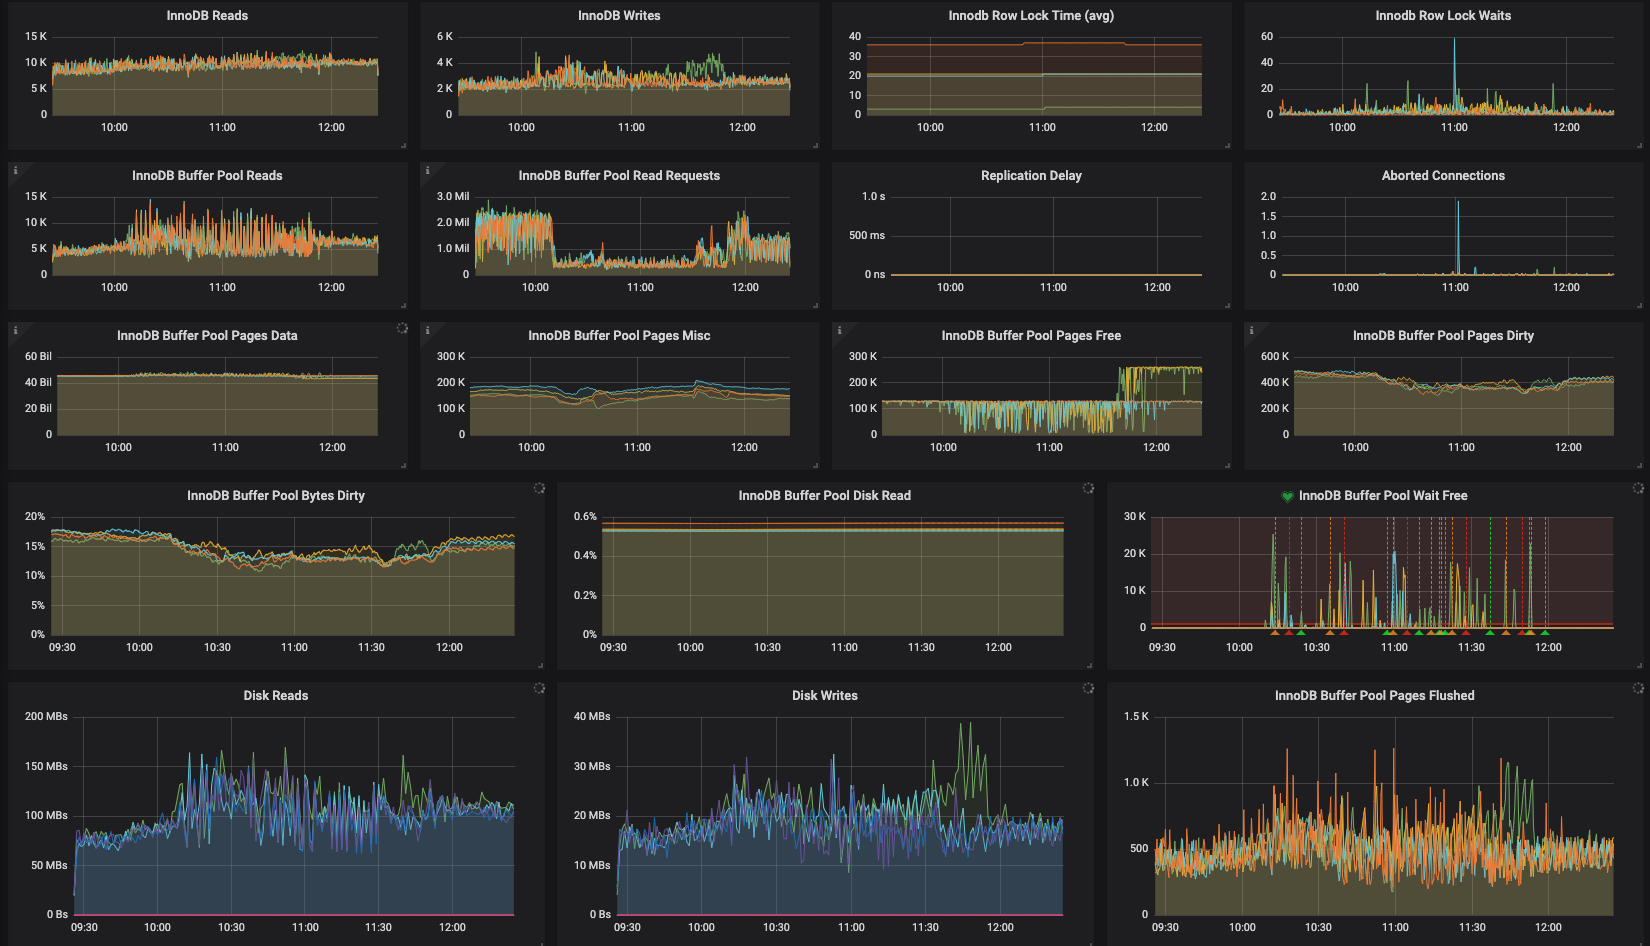
mariadb last 3hour dashboard

1
  • Do you have the slowlog turned on with a low value for long_query_time?
    – Rick James
    Commented May 11, 2019 at 4:39

3 Answers 3

4

what is the relationship between this LRU parameter and the database stalls I am experiencing?

The relationship is quite straightforward. The background flush thread every second will scan innodb_lru_scan_depth * innodb_buffer_pool_instances LRU list entries in an attempt to find dirty pages that it can write out to disk. Flushed pages become free and add to innodb_buffer_pool_pages_free.

If the DML thrown at your database produces dirty pages faster than the flush thread can write them out, at some point innodb_buffer_pool_pages_free will go down to zero, and the next attempt to read a page to the buffer pool will cause another innodb_buffer_pool_wait_free while the server flushes dirty pages to disk synchronously.

Ideally you would want the background flushing thread to write dirty pages to disk at the same rate (on average) as they are dirtied by the DML activities. You do that by increasing innodb_lru_scan_depth, which increases the probability of dirty pages being written to disk before the server needs more free pages.

An alternative, as mentioned in another answer, is to enable adaptive flushing and set the appropriate innodb_max_dirty_pages_pct and/or innodb_max_dirty_pages_pct_lwm values.

It should be noted that overly aggressive background flushing could saturate the I/O bandwidth on its own, which would be just as bad as excessive innodb_buffer_pool_wait_free events. At some point you might find that you will have to allocate more memory for buffer pools to satisfy your workload demands, or live with occasional free page waits.

1

Awesome question :)

MySQL says this about innodb_lru_scan_depth

innodb_lru_scan_depth

Specifies, per buffer pool instance, how far down the buffer pool LRU list the page cleaner thread scans looking for dirty pages to flush. This is a background operation performed once per second.

The default value for innodb_lru_scan_depth is 1024, and normally, the more buffer pools you have, the smaller you can make that value (ie: a value of 256 is not uncommon)

I have never seen a value as big as yours and I am curious where you got your value from?

This SO thread helped me greatly, in understanding innodb_lru_scan_depth https://stackoverflow.com/a/41155396

Two other interesting settings are innodb_max_dirty_pages_pct_lwm and innodb_max_dirty_pages_pct which control the max number of dirty pages in the buffer pool before aggressively flushing buffer pool pages https://dev.mysql.com/doc/refman/5.6/en/innodb-performance-adaptive_flushing.html

MySQL says this about those two parameters

innodb_max_dirty_pages_pct

InnoDB tries to flush data from the buffer pool so that the percentage of dirty pages does not exceed this value. Specify an integer in the range from 0 to 99. The default value is 75.

innodb_max_dirty_pages_pct_lwm

Defines a low water mark representing the percentage of dirty pages at which preflushing is enabled to control the dirty page ratio. The default of 0 disables the pre-flushing behavior entirely

This link could give you more insight into flushing mechanics https://dev.mysql.com/doc/refman/5.6/en/innodb-lru-background-flushing.html

What I would suggest, is to move innodb_lru_scan_depth down to 256 and keep an eye on memory consumption of innodb In particular, look at the number of pages in the buffer pool (old and young) and try to optimise from there

5
  • 1
    Clearly, if the OP says his system suffers from innodb_buffer_pool_wait_free stalls, background flushing is not aggressive enough as it is, and making it even less aggressive by lowering innodb_lru_scan_depth would be counterproductive.
    – mustaccio
    Commented May 10, 2019 at 18:21
  • MySQL says this Innodb_buffer_pool_wait_free Normally, writes to the InnoDB buffer pool happen in the background. When InnoDB needs to read or create a page and no clean pages are available, InnoDB flushes some dirty pages first and waits for that operation to finish. This counter counts instances of these waits. If innodb_buffer_pool_size has been set properly, this value should be small. What do you think is going to happen, when mysql tries to flush dirty pages, and walks off into a depth of 16384 ? Do you think it's going to be snappy? What's your suggestion? "clearly" Commented May 10, 2019 at 18:28
  • 1
    If the background flushing is configured optimally, the system should rarely reach zero free pages and therefore innodb_buffer_pool_wait_free will be a very rare occurrence. Granted, too aggressive background flushing could saturate the I/O channel on its own, so one needs to find a balance between flushing and other I/O demands.
    – mustaccio
    Commented May 10, 2019 at 18:42
  • I'm not clear on the flushing rates. It appears to be flushing fine. The rate is stable and the number of dirty pages remains in the 13-18% range. However, i've configured the range to be 50/75% and its never gotten that high before. So it is definitely already flushing more aggressively than it needs to be. Commented May 10, 2019 at 20:09
  • MySQL says this about a page: dev.mysql.com/doc/refman/8.0/en/glossary.html#glos_page "A unit representing how much data InnoDB transfers at any one time between disk (the data files) and memory (the buffer pool). A page can contain one or more rows, depending on how much data is in each row. If a row does not fit entirely into a single page, InnoDB sets up additional pointer-style data structures" @ChrisLeavoy What type of data does your db contain? What's your value of innodb_page_size dev.mysql.com/doc/refman/8.0/en/optimizing-innodb-diskio.html Commented May 10, 2019 at 22:23
1

This is an old question, which I think does not apply to recent versions of MariaDB, but still answering as I got here while writing about this subject for Percona Server and searching Google about it.

MariaDB 10.0 was using XtraDB 5.6 from Percona, which is using the backoff innodb_empty_free_list_algorithm by default. This algorithm has serious drawbacks that I cover in my blog post Tail Latencies in Percona Server because of InnoDB Stalls on Empty Free List. Read the post for all the details.

Your Answer

By clicking “Post Your Answer”, you agree to our terms of service and acknowledge you have read our privacy policy.

Not the answer you're looking for? Browse other questions tagged or ask your own question.