2

I need some urgent guidance for a tempdb issue for past last week:

The tempDB log file is growing starting a specific time, lets say 2 PM. And almost continue to grow upto 150 GB and then comes down after 10 or so hours.

I have used various queries listed here but nothing shows up as in that duration there is no long running transaction.

Queries of mix workload keeps coming and going. There is no stuck transaction as such.

The user databases on this instance are all part of Log shipping setup and log backups happen every 15 mins.

In addition i added the Xevent

CREATE EVENT SESSION [tempdb_file_size_changed] ON SERVER ADD EVENT 
sqlserver.database_file_size_change(SET collect_database_name=(1)ACTION(sqlserver.client_app_name,sqlserver.client_hostname,sqlserver.is_system,sqlserver.query_hash,sqlserver.session_id,sqlserver.session_nt_username,sqlserver.sql_text,sqlserver.username) WHERE ([database_id]=(2))) ADD TARGETpackage0.event_file(SET filename=N'C:\ExtendedEvents\TempDBGrowth.xel',max_file_size=(100),max_rollover_files=(25)) WITH (MAX_MEMORY=4096 KB,EVENT_RETENTION_MODE=ALLOW_SINGLE_EVENT_LOSS,MAX_DISPATCH_LATENCY=1 SECONDS,MAX_EVENT_SIZE=0 KB,MEMORY_PARTITION_MODE=NONE,TRACK_CAUSALITY=OFF,STARTUP_STATE=ON)

Nothing gets captured even in XE and its just blank in those 10 hours.

I have no clue what is eating my tempDB log as none of the queries or XE gets me the data. I have never seen this thing and generally get database growth using XE but here i am just clueless.

I am running DBCC SQLPERF(logspace) and i can see log used just keeps increasing by 1 Gb every 5 mins or so. We have TempDB log set to max 200 GB but by 10 hours its almost 160-180 GB and then suddenly comes down.

Running below query almost every time gives ACTIVE TRANSACTION.

SELECT log_reuse_wait, log_reuse_wait_desc 
FROM sys.databases d 
WHERE database_id = 2;

Please help what i might be doing wrong and why i cant see any transaction using TempDB log file usage?

Update- As requested in answer from @J.D, i checked and verified that there is no database mail or Service broker is being used internally to cause the growth:

However over last week i see the growth in log file of tempdb is zig zag and the trend of that zig zag growth is bit higher:

I need to help understand :-

How is the transaction log growth increasing upto 80% and then lowering down back to 0 and then increasing and growing and so on , with reaching lmoast max 90-95%.

I confirmed there is no manual shrinking going on. Could there be multiple processes contributing as this is OLTP server with tempdb usage throughout the day. Just dont understand how in last week it has grown near its max capacity?

thanks

4
  • Which level of isolation you are using for your databases at this server? Commented Apr 11, 2021 at 12:04
  • See if this could address your question --> dba.stackexchange.com/questions/19870/… Commented Apr 11, 2021 at 12:06
  • @Learning_DBAdmin: RCSI Commented Apr 11, 2021 at 18:42
  • @BeginnerDBA I'll try to post a stored procedure TempDBInfo tomorrow, when I get to my PC. That might help diagnosing a problem Commented Apr 12, 2021 at 18:20

3 Answers 3

2

What you are you seeing is by design for tempdb Transaction Log file. I wish Microsoft had better documentation on this.

How is the transaction log growth increasing upto 80% and then lowering down back to 0 and then increasing and growing and so on , with reaching almost max 90-95%.

From the First reference article:

Tempdb is not recovered in the event of a crash, and so there is no need to force dirty tempdb pages to disk, except in the case where the lazywriter process (part of the buffer pool) has to make space for pages from other databases.

A checkpoint is only done for tempdb when the tempdb log file reaches 70% full – this is to prevent the tempdb log from growing if at all possible (note that a long-running transaction can still essentially hold the log hostage and prevent it from clearing, just like in a user database).

Of course, when you issue a manual CHECKPOINT, all the dirty pages are flushed, but for automatic checkpoints, they’re not.

I suggest you monitor your tempdb Transaction Log usage and set it to a reasonable size that under normal workload it does not have to grow and shrink.

I do not know exactly why your tempdb logfile filled to 100%. There has to be a reason why the log file did not get truncated.

Will indirect checkpoint help?

In most cases no.

Any non-logged “bulk” operation that qualifies for an “eager write” in tempdb is not a candidate to be flushed by the recovery writer (the internal thread that runs the indirect checkpoint).

This raises an important question: which data load operation is minimally logged on tempdb? This is important to know because minimally logged operations on tempdb will not be flushed by the indirect checkpoint. The following list can be used to assist you in understanding which load operations on tempdb will be minimally logged and which will not.

For details read Tempdb – Here’s a Problem You Didn’t Know You Had by Fabiano Amorim

I noticed this question is for SQL Server 2014, if someone is reading this for SQL Server 2016 read the below documentation by Microsoft.

  1. Database Checkpoints (SQL Server) - check the "Indirect Checkpoint" section.
  2. Change the Target Recovery Time of a Database (SQL Server).
  3. Indirect Checkpoint and tempdb – the good, the bad and the non-yielding scheduler by Parikshit Savjani

Reference:

  1. What does checkpoint do for tempdb? by Paul Randal
  2. See question and answer section Inside the Storage Engine: What’s in the buffer pool? by Paul Randal
4
  • Thanks for your answer. However i do not understand, if checkpoint is happening at 70% of tran log full why its not happening since last week. I read for long running query but i have monitoring tool and personally have been monitoring via sp_whoisactive, i do not see any long running. Though i admit, we do see queries running using tempdb but they are quick to complete. Commented Apr 12, 2021 at 3:27
  • Also does changing indirect checkpoint for TempDB does help in situation for SQL2014? Commented Apr 12, 2021 at 3:29
  • You are 100% right. I monitored the pattern and tempdb zig zag was happening at 70% due to max growth setting we have. I learned something new , thanks to you and Paul's article. But i am really curious why this 70% did not work when my tempdb hit 100% full? how should we avoid , increase more space or indirect checkpoints may help, please suggest Commented Apr 12, 2021 at 4:22
  • Edited my answer. Please let me know if I can help further. Commented Apr 12, 2021 at 17:06
1

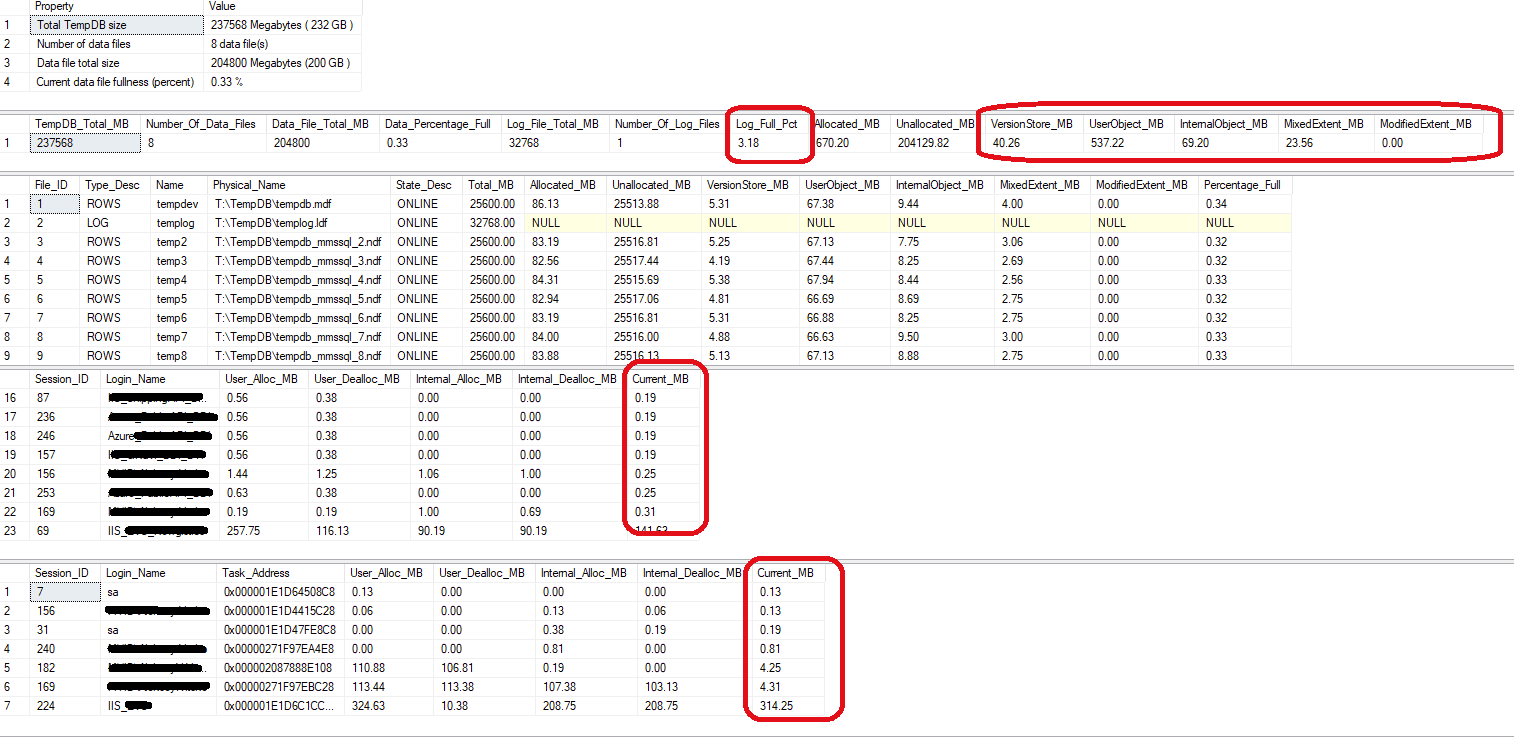
Try using the TempDBInfo procedure, it shows what currently is inside TempDB's files and who is using it most

https://github.com/aleksey-vitsko/Database-Administrator-Tools/blob/master/TempDB%20-%20TempDBInfo.sql

Procedure is not fully finished, I am going to rework the way it shows summary information, and also I am planning to add logging capabilities

But it is still good at looking who is the current consumer (which session or task is using most) and might help you to diagnose the problem

Here what it shows for me:

TempDBInfo

If you have any comments or suggestions for SP, let me know

1
  • Thanks for your answer Commented Apr 13, 2021 at 13:33
0

Interesting that you don't see any running transactions but it continues to grow, as there has to be an underlying cause. Have you explored the last piece of advice Aaron mentions in that answer you linked?

You may also consider that your tempdb log usage may be caused by internal processes that you have little or no control over - for example database mail, event notifications, query notifications and service broker all use tempdb in some way. You can stop using these features, but if you're using them you can't dictate how and when they use tempdb.

Outside of that you might want to start looking into look into WhoIsActive which is an amazing query by Adam Machanic that essentially shows every running query on a server with some performance analysis information, and/or some of the procedures in the First Responder Kit by Brent Ozar's team such as sp_BlitzFirst, sp_BlitzWho, or sp_BlitzCache. You can even try scheduling a job that routinely runs and caches any of these, so you can get the before, during, and after story of what's going on with your SQL Server.

2
  • 1
    thanks for your answer. Edited my question with inputs Commented Apr 11, 2021 at 3:19
  • Just FYI, if it helps please see my comment to other answer and may be you will get an idea what this mystery is. I am just joining the puzzles together. Thanks again Commented Apr 12, 2021 at 4:23

Your Answer

By clicking “Post Your Answer”, you agree to our terms of service and acknowledge you have read our privacy policy.

Not the answer you're looking for? Browse other questions tagged or ask your own question.