0

I run SQL Server 2019 with CU13 in Hyper-V vm and it seems that my hosting company is saying my sql server is doing too much disk io. I am not a dba so i did poke around and found some queries that I ran which I am posting here hoping someone would tell me what my next steps should be, please and thank you.

vps: 6 core intel e5-2690 ram: 32 gb disk: WD Blue™ SN550 NVMe™ SSD

I have ran the following queries
SELECT  DB_NAME(fs.database_id) AS [Database Name] ,
        mf.physical_name ,
        io_stall_read_ms ,
        num_of_reads ,
        CAST(io_stall_read_ms / ( 1.0 + num_of_reads ) AS NUMERIC(10, 1)) AS [avg_read_stall_ms] ,
        io_stall_write_ms ,
        num_of_writes ,
        CAST(io_stall_write_ms / ( 1.0 + num_of_writes ) AS NUMERIC(10, 1)) AS [avg_write_stall_ms] ,
        io_stall_read_ms + io_stall_write_ms AS [io_stalls] ,
        num_of_reads + num_of_writes AS [total_io] ,
        CAST(( io_stall_read_ms + io_stall_write_ms ) / ( 1.0 + num_of_reads
                                                          + num_of_writes ) AS NUMERIC(10,
                                                              1)) AS [avg_io_stall_ms]
FROM    sys.dm_io_virtual_file_stats(NULL, NULL) AS fs
        INNER JOIN sys.master_files AS mf WITH ( NOLOCK ) ON fs.database_id = mf.database_id
                                                             AND fs.[file_id] = mf.[file_id]
ORDER BY avg_io_stall_ms DESC
OPTION  ( RECOMPILE );

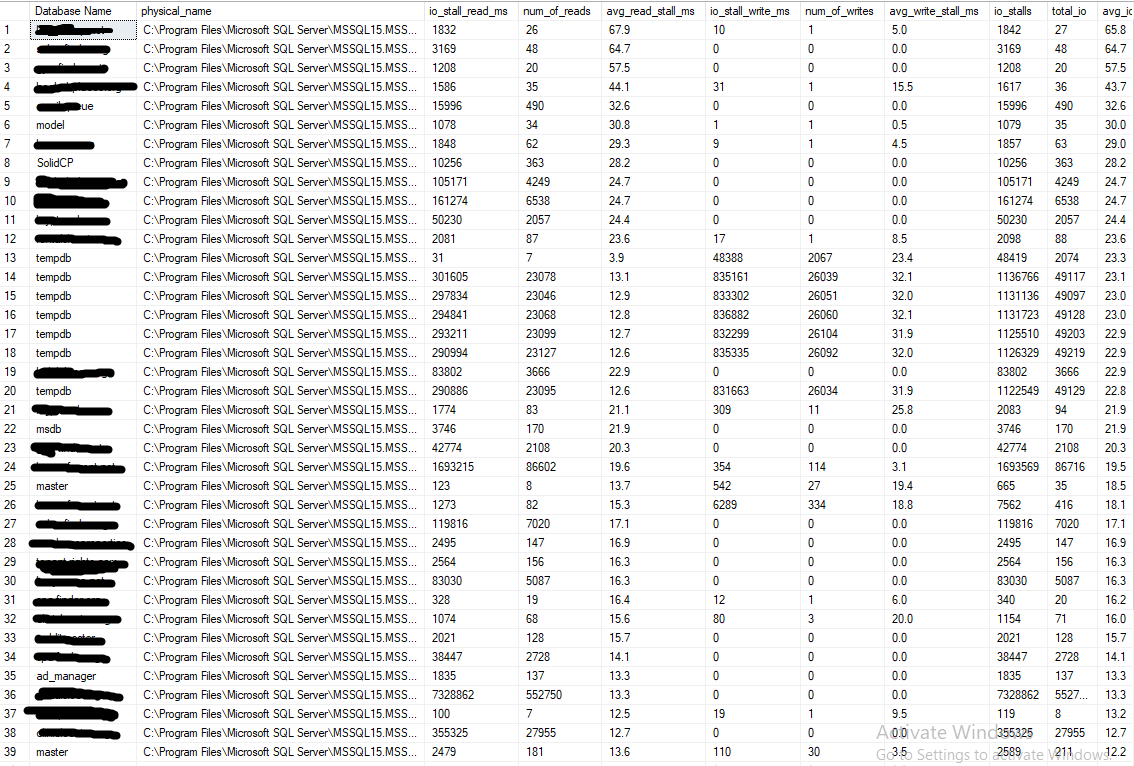
result of the above enter image description here

SELECT TOP 10
        wait_type ,
        max_wait_time_ms wait_time_ms ,
        signal_wait_time_ms ,
        wait_time_ms - signal_wait_time_ms AS resource_wait_time_ms ,
        100.0 * wait_time_ms / SUM(wait_time_ms) OVER ( ) AS percent_total_waits ,
        100.0 * signal_wait_time_ms / SUM(signal_wait_time_ms) OVER ( ) AS percent_total_signal_waits ,
        100.0 * ( wait_time_ms - signal_wait_time_ms )
        / SUM(wait_time_ms) OVER ( ) AS percent_total_resource_waits
FROM    sys.dm_os_wait_stats
WHERE   wait_time_ms > 0 -- remove zero wait_time
        AND wait_type NOT IN -- filter out additional irrelevant waits
( 'SLEEP_TASK', 'BROKER_TASK_STOP', 'BROKER_TO_FLUSH', 'SQLTRACE_BUFFER_FLUSH',
  'CLR_AUTO_EVENT', 'CLR_MANUAL_EVENT', 'LAZYWRITER_SLEEP', 'SLEEP_SYSTEMTASK',
  'SLEEP_BPOOL_FLUSH', 'BROKER_EVENTHANDLER', 'XE_DISPATCHER_WAIT',
  'FT_IFTSHC_MUTEX', 'CHECKPOINT_QUEUE', 'FT_IFTS_SCHEDULER_IDLE_WAIT',
  'BROKER_TRANSMITTER', 'FT_IFTSHC_MUTEX', 'KSOURCE_WAKEUP',
  'LAZYWRITER_SLEEP', 'LOGMGR_QUEUE', 'ONDEMAND_TASK_QUEUE',
  'REQUEST_FOR_DEADLOCK_SEARCH', 'XE_TIMER_EVENT', 'BAD_PAGE_PROCESS',
  'DBMIRROR_EVENTS_QUEUE', 'BROKER_RECEIVE_WAITFOR',
  'PREEMPTIVE_OS_GETPROCADDRESS', 'PREEMPTIVE_OS_AUTHENTICATIONOPS', 'WAITFOR',
  'DISPATCHER_QUEUE_SEMAPHORE', 'XE_DISPATCHER_JOIN', 'RESOURCE_QUEUE' )
ORDER BY wait_time_ms DESC

enter image description here

5
  • For further context, can you tell how big the user databases are, so SolidCP and ad_manager? 32 GB of RAM and you are seeing some RESOURCE_SEMAPHORE waits, so it is possible that the server has high disk activity because it is actually memory constrained and constantly needs to pull data into RAM from disk.
    – BCM
    Commented Oct 22, 2021 at 13:18
  • i blurred out name of all my databases, but they range from 300mb to 10gb. I have limited the sql server to use a maximum of 16gb of ram I can show any screenshots that may help solve the problem, I will also remove the limit on the memory of sql server see if that solves anything The limit was put in a long time ago and there was no disk io issue since then, vps hoster says the high disk io has been happening in the last couple of days (cannot confirm this myself, not sure how)
    – Zoinky
    Commented Oct 22, 2021 at 13:23
  • You should exclude those top 3 waits as well. They are all background waits. With 32GB of RAM you should give more to SQL Server if it's a dedicated SQL Server. Looks like all your IO is TempDB. Use Query Store to identify the most expensive queries. Commented Oct 22, 2021 at 13:49
  • How long had the instance been up when your ran the sys.dm_io_virtual_file_stats query? Total IO does not seem excessive.
    – Dan Guzman
    Commented Oct 22, 2021 at 13:53
  • The answer is likely in your queries. I'd suggest getting an Extended Events session and capture query metrics over time and then identify the ones using the most IO. Tune or adjust as appropriate from there. Commented Oct 22, 2021 at 14:48

2 Answers 2

0

I believe removing the memory limit is a good choice. I may get "pig piled" for this but I have used the default 2147483647 for max memory before on systems where SQL Server is the only app running and SQL Server does a pretty good job of grabbing what it needs without causing the OS to page out memory. If you choose a limit make sure you leave 4-6GB for the OS. You might also want to look at Cost Threshold and MAX Degree Of Parallelism server settings as the default is probably not ideal for 6 processors.

0

The answer seems pretty much hidden in those wait stats.

I probably see you have LCK.. waits followed by resource semaphore.

It’s just a wild guess but probably you have queries being run ( could be in multiple threads ) even with large memory grants. When such will run it will make other queries wait on further memory to be granted. So either you have insane max memory settings or just running low on memory for such queries needing large memory grants. You can also find those queries and tune if possible via indexing to reduce unwanted memory grants.

Also there is a possible blocking out there and why you see those lock waits .

Highly recommended you also run sp_whoisactive by Adam here http://whoisactive.com/

This should get you to an idea what’s running on your sql server causing those waits and probably where it’s worth effort to tune further

Your Answer

By clicking “Post Your Answer”, you agree to our terms of service and acknowledge you have read our privacy policy.

Not the answer you're looking for? Browse other questions tagged or ask your own question.