0

I have a particular stored procedure that takes 1 parameter.

This proc is executed once a day with the same parameter value everyday. The row count is also the same with each run of the proc.

Day 1 - Runs for 10 minutes.

Day 2 - Runs for 8 hours.

Each run produces the exact same query plan.

In an attempt to remedy this, I added OPTION (RECOMPILE) to the problematic statement and it seems to have fixed it. It's been 5 days and each run has been 10 minutes.

My understanding of bad parameter sniffing is when the cached query plan is not optimal for certain parameter values.

So, how do I actually define this problem?

What would cause this drastic change in runtimes if the query plan is exactly the same and the parameter value is the same?

Edit: Query Store is enabled on the database. Using this, I was able to determine that the query plans are identical between good and bad runs.

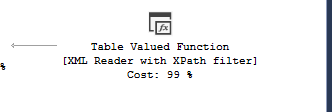
This is the part of the query plan that does the bulk of the work.

enter image description here

Thanks

10
  • which SQL Server version you have ? Commented Nov 6, 2023 at 8:44
  • SQL Server 2019 Commented Nov 6, 2023 at 9:25
  • 2
    "that does the bulk of the work" is probably not true, estimates involving XML or other Table Functions are notoriously inaccurate. Please show the full query, and please share the query plan via pastetheplan.com Commented Nov 6, 2023 at 12:08
  • This is not really a parameter sniffing issue when it's always the same value and data statistics. If the query plans are truly identical, then your issue is likely something external, causing one run to wait longer than another. It could be hardware contention, or it could be a sign of failing hardware, or it could be something happening external to the SQL Server that the query is waiting on (depending on what the query does), etc. But no way to say without seeing the good and bad run query plans which you should upload and link in your Post, as Charlieface mentioned.
    – J.D.
    Commented Nov 6, 2023 at 13:47
  • check Waits of your stored procedure. Maybe it is being blocked by something, or experiencing any other wait type Commented Nov 6, 2023 at 14:04

1 Answer 1

0

If the query plan really doesn't change then it's not a parameter sniffing issue. Some more information is needed to diagnose this issue though. Maybe there is a subtle difference in the query plans that is not immediately obvious. If the query has scalar functions, these execute in their own context with their own associated query plans. We can only make guesses at this point though.

What would be useful would be to capture what the query is doing at various points in its execution. Community scripts like sp_whoisactive, and sp_BlitzWho are useful here. You can see the statement currently executing. The current wait type and session level wait information are useful for diagnosing the problem.

Also, consider a monitoring tool – I created an open-source tool DBA Dash. This will automatically capture the running query information (similar to sp_whoisactive or sp_BlitzWho). If you had the tool running, you could go back in time and work out exactly why your query was slow 6 days ago. It will help if the problem re-occurs while you are not around to troubleshoot.

Your Answer

By clicking “Post Your Answer”, you agree to our terms of service and acknowledge you have read our privacy policy.

Not the answer you're looking for? Browse other questions tagged or ask your own question.