3

My team uses Oracle 11 and SQL Developer. I've been relying heavily on explain plans lately to try and determine the most efficient way to solve various problems. Recently, a coworker pointed out that explain plan is not always accurate to what actually happens in the database, and that an autotrace is a better indication since the query is actually run against the data.

Testing a query, I've gotten the following results

_________________________________
|      Method        |   Cost   | 
|--------------------|----------|
| Query A Explain    |  306,188 |
| Query A Autotrace  |  399,131 |
| Query B Explain    |   99,226 |
| Query B Autotrace  |  137,661 |
|____________________|__________|

When using the autotrace, query A had a cost increase of 30% and Query B of nearly 40%. Obviously, I should be using query b in both cases, but I don't understand what causes them to differ.

2
  • What "traceroute" are you using? Normally, traceroute is an application that tracks network hops not something dealing with query plans. Are you comparing actual vs. estimated query plans? Or is this some third party utility with an unfortunately confusing name? As an aside, I would not say that B is obviously more efficient than A. It's certainly possible that's the case. But a cost that is too low is just as likely to indicate a problematic query plan as a cost that is too high. Commented Jul 15, 2015 at 18:29
  • @JustinCave: Woops... Should have paid more attention to what I allowed spell check to replace. I meant to say autotrace, which is a tool built into SQL Developer just like explain.
    – Jacobm001
    Commented Jul 15, 2015 at 18:33

2 Answers 2

5

There are a number of things that can cause the actual plan to differ from the estimated plan (and if you want to get really deep in the weeds, there are lots of things that can cause different methods of producing the actual plan to produce different results but I'll ignore that).

The simplest (and most common) revolve around bind variables. If I do an EXPLAIN PLAN on a simple query like

SELECT COUNT(*)
  FROM my_table
 WHERE col1 = :1

Oracle has no information about what value I might pass in for col1 so it does a very generic estimate. If there are 20 distinct values, for example, it will probably guess that the query would need to access 5% of the rows in the table. If you actually execute this statement and pass in a value, on the other hand, Oracle has a lot more information-- it may know from a histogram that the value you passed in will actually require it to access 7% of the rows in the table. If the actual query plan remains unchanged, it's entirely plausible that the cost would increase by 40% since the expected amount of work grew by 40%.

A complete list of everything that causes details from an estimated query plan to differ from details from an actual query plan and an explanation of how those things interact would be much too long for this format (particularly since a lot of the items get very complicated very quickly). There are situations where statistics on an object are missing, for example, where the optimizer has to do a random sample of the data to infer the statistics at compile time that will differ a bit every time the query is compiled. There are a number of situations where the optimizer has some sort of feedback mechanism that kicks in when a query is being run that it doesn't have when a query plan is being estimated-- it may choose a degree of parallelism based on available resources, it may change the cost of a sort depending on how much PGA space it can get, depending on the version it may be able to change course if an operation retrieves substantially more or less data than it expected. There are effects do to plans being cached or different technologies that try to ensure plan stability kicking in when queries are actually compiled.

6

Autotrace in SQL Developer gets the plan from v$sql_plan, and also gets the stats from your session, does a delta of session stats before and after running the query.

Explain Plan asks the database what it THINKS the plan will be for your query.

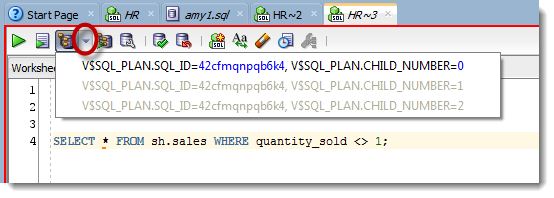
Your co-worker is right, they can differ wildly, and you're better served to use AutoTrace or our new feature in 4 and higher where we show the cached plan (a drop down control on the explain plan button makes these available.)

enter image description here

2
  • 1
    Hi @thatjeffsmith. I'm the co-worker. :) So THAT'S what the drop-down on the explain plan button does. Geez, I could never find documentation on that anywhere. If you have a few spare cycles, would you please elaborate just a little on the drop-down feature, especially: what do you mean by "cached plan" (for example, is that an estimated plan or the actual plan that was used), and what causes more of the child plans to be populated. Thank you!
    – leqid
    Commented Jul 16, 2015 at 21:43
  • 3
    An Explain Plan = ask the database what it thinks the plan will be to execute a SQL statement What DBMS_XPLAN, AutoTrace show - the last plan actually used to execute the sql statement. The database doesn't build the plan for every execution, that would be expensive. So it saves them for re-use. You can see these in v$sql_plan. The dropdown looks at your query, determines the sqlID, then looks it up in that view. A very simplistic explanation, but that's the gist of it. This post explains child cursors behindoracle.blogspot.com/2014/03/… Commented Jul 17, 2015 at 17:41

Your Answer

By clicking “Post Your Answer”, you agree to our terms of service and acknowledge you have read our privacy policy.

Not the answer you're looking for? Browse other questions tagged or ask your own question.