6

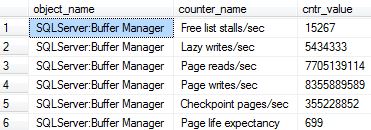
Our production server (2012, VM + SAN) has 32 GB of RAM, the database size is ~80GB. The application uses TempDB heavily - disk is hit ~100 MBps both reads & writes. Seeing tons of SQL compilations/sec .. 95% of all batch requests are compilations.

Ideally would like to increase the RAM to 64GB or 128GB, but need to 'prove' to team that it's required.

Buffer Cache Hit Ratio (BCHR) is 99.9%, but Page Life Expectancy (PLE) is only ~400.
What's the explanation for this ?
I though PLE & BCHR had a linear relationship (i.e. they increase or decrease together)

On other VMs with larger databases and lot more RAM, both BCHR & PLE are high.

Current wait stats and perf counters enter image description here enter image description here

2
  • What is output of select @@Version
    – Shanky
    Commented Jul 12, 2016 at 17:37
  • 1
    Are there performance problems? I'd go after specific problems and find out why they specifically exist.
    – usr
    Commented Jul 12, 2016 at 19:37

2 Answers 2

9

BCHR can be very misleading due to read-ahead:

The Database Engine supports a performance optimization mechanism called read-ahead. Read-ahead anticipates the data and index pages needed to fulfill a query execution plan and brings the pages into the buffer cache before they are actually used by the query. This allows computation and I/O to overlap, taking full advantage of both the CPU and the disk.[link]

You are very likely seeing the impact of read-ahead filling the buffer cache pre-emptively, which distorts the BCHR counter. Excellent and very in-depth article from Jonathan Kehayias titled Great SQL Server Debates: Buffer Cache Hit Ratio covers this.

6
  • Good point. I completely missed out on his BCHR. That could be another cause. Without more info from OP it will be hard to speculate but thanks for sharing. Commented Jul 12, 2016 at 17:06
  • I think that was too early for answer, you might as well have asked SQL Server version.
    – Shanky
    Commented Jul 12, 2016 at 17:36
  • 1
    @Shanky Why? It's not relevant to the question or answer. Commented Jul 13, 2016 at 11:56
  • I was thinking if you could have asked version of SQL Server. The PLE behavior was a bug in SQL Server 2012(OP is using SS 2012) where for no reason it would just plummet while every other counter would remain same. Plus the answer would really require some examination of what actually is issue. What you suggested is correct but does not seems to answer the question.
    – Shanky
    Commented Jul 13, 2016 at 12:10
  • 1
    What's the explanation for this? - Answered. I though PLE & BCHR had a linear relationship (i.e. they increase or decrease together) - Answered. We look forward to seeing your more indepth answer @Shanky. Commented Jul 13, 2016 at 13:51
2

PLE just tells you how long the oldest page has been stored in memory before being evicted due to memory pressure. It could be that you have a high frequency of little queries that hit cache and perhaps a large one that flushes out the cache and requires them to recache. Without having additional data this looks like an environment that perhaps is split between heavy tables (reporting?) and OLTP. Or something where you just have a lot of little queries but for some reason the cache is just being pushed out hard and fast.

You mention it's virtual, if it's VMWare, do you have the balloon driver enabled? If so it can cause this issue. Is SQL Server using all the memory allocated? I'm not sure if you can do this in your environment but you can test further with 'lock pages in memory' but not advised if this is a heavily used prod box without additional testing.

3
  • This is a large application with thousands of users passing different parameters for both queries (searches) and updates. SQL server is using all memory allocated (as is case with every server, it will fill buffer with as much data as it can). Lock pages in Memory is already set when server was setup. I just edited my question - compilations/sec is very high. I'm checking about Balloon driver since I don't have access into vSphere
    – d-_-b
    Commented Jul 12, 2016 at 17:08
  • 2
    Thanks. Per chance do you have a high level of table scans as well? I've seen this fixed several times with indexing a couple of very expensive queries but that was for a server with a smaller workload. In that case the table scan of a large table was pushing memory out which fulfilled a big query, while the others were very small. Might be a compounded issue. Commented Jul 12, 2016 at 17:22
  • checked indexes, look fine. these are some wait stat/counters - imgur.com/a/I8ZQn
    – d-_-b
    Commented Jul 12, 2016 at 18:14

Your Answer

By clicking “Post Your Answer”, you agree to our terms of service and acknowledge you have read our privacy policy.

Not the answer you're looking for? Browse other questions tagged or ask your own question.