2

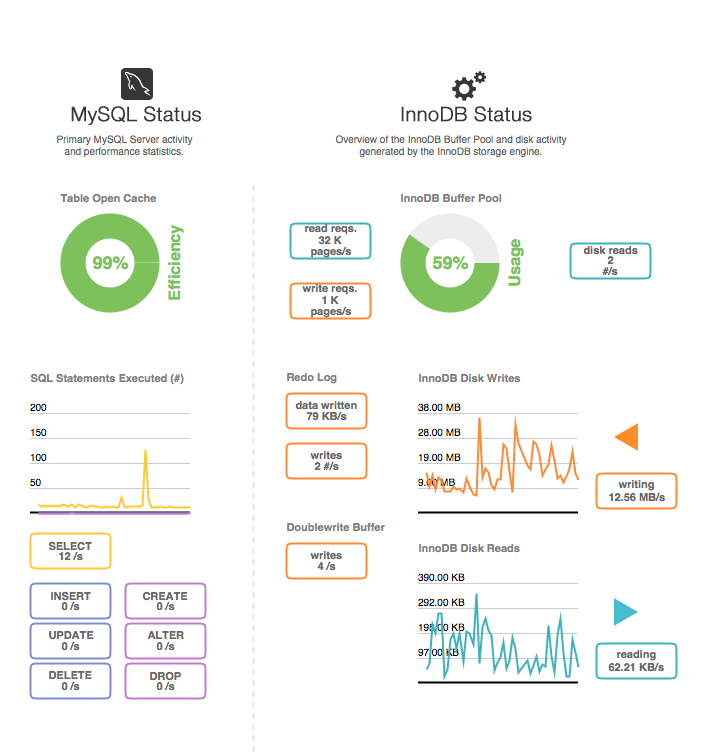
I am not a dedicated mysql admin but my friend and I have been working hard to fix the badly configured mysql files. We have reduced our number of pools to 2 from 20 and increased pool size to 90GB for a 124GB ram server. I've also enabled file_per_table. What is bugging me is the constant spikes in disk read/write speeds. Picture below is while the server is under decent load (file parsing into db) and it has been up with the updated config for about two days. enter image description here
my.cnf file

max_connections = 1000
max_connect_errors = 10
max_allowed_packet = 1G
binlog_cache_size = 1M
max_heap_table_size = 3072M
table_open_cache = 20000
table_definition_cache = 20000
read_buffer_size = 64M
read_rnd_buffer_size = 8M
join_buffer_size = 64M
sort_buffer_size = 64M
key_buffer_size = 4M
thread_cache_size = 8
query_cache_size=0
query_cache_limit = 128K
ft_min_word_len = 4
memlock
thread_stack = 256K
transaction_isolation = READ-COMMITTED
tmp_table_size = 3G
tmpdir = /mysql-tmp
group_concat_max_len = 33554432
ignore-db-dir=lost+found
server-id = 1
secure-file-priv = "/tmp/"

# *** INNODB Specific options ***
innodb_buffer_pool_size = 92160M
innodb_buffer_pool_instances=2
innodb_data_file_path=ibdata1:12M:autoextend
innodb_file_per_table=ON
innodb_data_home_dir=
innodb_thread_concurrency = 0
innodb_flush_log_at_trx_commit = 0
innodb_flush_method = O_DIRECT
innodb_read_io_threads = 16
innodb_write_io_threads = 16
innodb_log_buffer_size = 8M
innodb_log_file_size = 2G
innodb_log_files_in_group = 2
innodb_io_capacity = 30000
innodb_max_dirty_pages_pct = 60
innodb_lock_wait_timeout = 120
innodb_file_format = Barracuda
innodb_file_format_max = Barracuda
innodb_adaptive_hash_index=ON
innodb_large_prefix
innodb_autoinc_lock_mode = 0

numactl --hardware

available: 2 nodes (0-1)
node 0 cpus: 0 2 4 6 8 10 12 14 16 18 20 22
node 0 size: 65490 MB
node 0 free: 4880 MB
node 1 cpus: 1 3 5 7 9 11 13 15 17 19 21 23
node 1 size: 65536 MB
node 1 free: 9789 MB
node distances:
node   0   1
  0:  10  20
  1:  20  10

Harddisk info smartctl -a /dev/sda -d sat+megaraid,00

=== START OF INFORMATION SECTION ===
Model Family:     Seagate Constellation ES (SATA 6Gb/s)
Device Model:     ST500NM0011
User Capacity:    500,107,862,016 bytes [500 GB]
Sector Size:      512 bytes logical/physical
Device is:        In smartctl database [for details use: -P show]
ATA Version is:   8
ATA Standard is:  ATA-8-ACS revision 4
Local Time is:    Mon Jun 19 10:45:43 2017 CDT
SMART support is: Available - device has SMART capability.
SMART support is: Enabled

We are altering an existing config file and I do not want to touch stuff that I do not know about. I am not a mysql admin. If you see a setting that makes no sense to you, please let me know. In addition to reducing the pool count to 2 from 20 and increasing the pool size to 90gb from 20gb, I've also set read/write thread counts to 16 each. I did not get a chance to restart the server after adding the thread counts (clients are on it all the time) but I've done the same number for my other servers and they all felt much better.

I don't know ... we are all just doing try and see method here but this inconsistent read/write speeds are making me think something is not right and I am not sure where to look.

Update 1

I've written a script to go through the database and call OPTIMIZE TABLE on every table. I do not think that was done before, ever... After I've done that, pool usage value jumped to %95+ on all servers but the efficiency value decreased.

Here is a gist of more information

Thank you for your time!

1 Answer 1

1

(Analysis of VARIABLES and STATUS)

The More Important Issues

Ponder why there are so many deletes/second and deletes/insert. Deletes need to eventually update indexes; this may be part of the original problem.

Shrink tmp_table_size and max_heap_table_size to 1G. (3G is dangerously high for 124GB of RAM.) Running out of RAM leads to swapping, which is very I/O intensive.

Turn on the slowlog and have long_query_time=1. Wait a day. Digest via mysqldumpslow -s t or pt-query-digest. Then review the 'worst' few queries. (A lot of tmp tables are being created. Lots of table scans. Etc.)

The table scans may be flushing stuff from cache (buffer_pool), thereby leading to extra I/O. (24/sec and 63% of selects -- quite high.)

Perhaps the I/O spikes occur near the OPTIMIZEs? Get rid of OPTIMIZE; it is only rarely useful for InnoDB.

Increase thread_cache_size to, say, 30.

Keep in mind that the buffer_pool is a "cache". As such, it does not have to be "full" to be efficient. In particular, if you are not looking at much data, the cache will not be very full. On the other hand, OPTIMIZE will look at all the data, thereby fill up, and probably overflow, the cache. Hence, the drop in efficiency that you experienced. Another argument against running OPTIMIZE. Cache efficiency will eventually improve -- that is the way caches work. But it will stay at 95%; this is neither "good", nor "bad".

A metrics for buffer_pool efficiency: Innodb_pages_read / Innodb_buffer_pool_read_requests, which is < 0.01% for you and Also Innodb_pages_written / Innodb_buffer_pool_write_requests, which is 0.66%. Both numbers are very good.

Details and other observations

( table_open_cache ) = 20,000 -- Number of table descriptors to cache -- Several hundred is usually good.

( innodb_buffer_pool_size / innodb_buffer_pool_instances ) = 87040M / 2 = 43520MB -- Size of each buffer_pool instance. -- An instance should be at least 1GB. In very large RAM, have 16 instances.

( innodb_max_dirty_pages_pct ) = 60 -- When buffer_pool starts flushing to disk -- Are you experimenting?

( Innodb_os_log_written ) = 412,191,985,152 / 697472 = 590979 /sec -- This is an indicator of how busy InnoDB is. -- Very idle or very busy InnoDB.

( Innodb_log_waits / Innodb_log_writes ) = 6,268 / 625773 = 1.0% -- Frequency of needing to wait to write to log -- Increase innodb_log_buffer_size. It is currently 8M; perhaps 64M.

( Innodb_rows_deleted / Innodb_rows_inserted ) = 82,126,182 / 116,159,708 = 0.707 -- Churn 117 deletes/sec -- "Don't queue it, just do it." (If MySQL is being used as a queue.)

( join_buffer_size ) = 64M -- 0-N per thread. May speed up JOINs (better to fix queries/indexes) (all engines) Used for index scan, range index scan, full table scan, each full JOIN, etc. -- Use the default.

( min( tmp_table_size, max_heap_table_size ) / _ram ) = min( 3072M, 3072M ) / 126976M = 2.4% -- Percent of RAM to allocate when needing MEMORY table (per table), or temp table inside a SELECT (per temp table per some SELECTs). Too high may lead to swapping. -- Decrease tmp_table_size and max_heap_table_size to, say, 1% of ram.

( max_tmp_tables * tmp_table_size / _ram ) = 32 * 3072M / 126976M = 77.4% -- Pct of RAM potentially consumed by tmp tables -- Swapping is bad; decrease max_tmp_tables and/or tmp_table_size. Or lower innodb_buffer_pool_size.

( bulk_insert_buffer_size / _ram ) = 8M / 126976M = 0.01% -- Buffer for multi-row INSERTs and LOAD DATA -- Too big could threaten RAM size. Too small could hinder such operations.

( (Queries-Questions)/Queries ) = (198989120-24519754)/198989120 = 87.7% -- Fraction of queries that are inside Stored Routines. -- (Not bad if high; but it impacts the validity of some other conclusions.)

( Created_tmp_tables ) = 31,676,853 / 697472 = 45 /sec -- Frequency of creating "temp" tables as part of complex SELECTs.

( tmp_table_size ) = 3072M -- Limit on size of MEMORY temp tables used to support a SELECT -- Decrease tmp_table_size to avoid running out of RAM. Perhaps no more than 64M.

( Handler_read_rnd_next / Com_select ) = 227,082,268,849 / 26103795 = 8,699 -- Avg rows scanned per SELECT. (approx) -- Consider raising read_buffer_size

( Select_scan ) = 16,481,466 / 697472 = 24 /sec -- full table scans -- Add indexes / optimize queries (unless they are tiny tables)

( Select_scan / Com_select ) = 16,481,466 / 26103795 = 63.1% -- % of selects doing full table scan. (May be fooled by Stored Routines.) -- Add indexes / optimize queries

( sort_buffer_size ) = 64M -- One per thread, malloced at full size until 5.6.4, so keep low; after that bigger is ok. -- This may be eating into available RAM; recommend no more than 2M.

( Com_optimize ) = 35,195 / 697472 = 0.05 /sec -- How often OPTIMIZE TABLE is performed. -- OPTIMIZE TABLE is rarely useful, certainly not at high frequency.

( long_query_time ) = 10.000000 = 10 -- Cutoff (Seconds) for defining a "slow" query. -- Suggest 2

( Connections ) = 3,674,134 / 697472 = 5.3 /sec -- Connections -- Increase wait_timeout; use pooling?

( Threads_created / Connections ) = 151,089 / 3674134 = 4.1% -- Rapidity of process creation -- Increase thread_cache_size (non-Windows)

3
  • Don't be discouraged if shrinking the tmp_table_size shows no improvement. It becomes important when you have lots of connections all needing tmp tables -- this is when you risk swapping, which involves lots of I/O and slowdown. I have no proof that you actually hit that problem.
    – Rick James
    Commented Jul 5, 2017 at 18:44
  • 10-4. I've increased thread_cache_size to 32 and I do not know if it is placebo effect or not but it does feel faster. I opened up another client while the other was parsing files in and page opened faster and I was able to run reports in software without the initial wait. We are planning on upgrading our ram to the size of the database on the disk. On some servers this may well reach to 512gb ram. Do you think that would be worth it? One server we have 200GB difference between the db disk size and the ram we have.
    – ODelibalta
    Commented Jul 5, 2017 at 19:39
  • thread_cache_size may speed up making a new connection, so your perception may be real. More RAM: It depends on a lot of things. In simplistic (but not very useful) terms: "the buffer_pool needs to be big enough for the working set size". Suggest you finish with other tips before spending the money on RAM.
    – Rick James
    Commented Jul 5, 2017 at 19:52

Your Answer

By clicking “Post Your Answer”, you agree to our terms of service and acknowledge you have read our privacy policy.

Not the answer you're looking for? Browse other questions tagged or ask your own question.