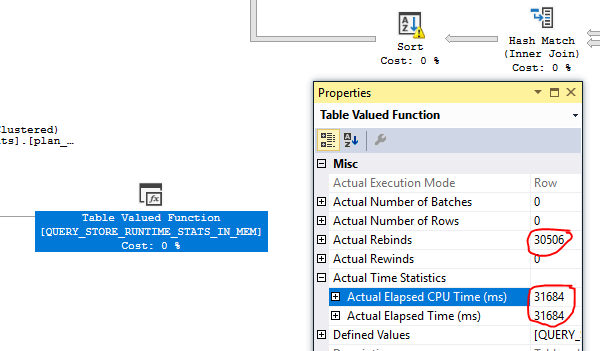
I'll say from the beginning that my question/problem looks similar to this previous one, but since I'm not sure if the cause or the starting info is the same, I decided to post my question with some more details.
Issue at hand:
- at a strange hour (near the end of business day) a production instance starts to behave erratically:
- high CPU for the instance (from a baseline of ~30% it went to about double and was still growing)
- increased number of transactions/sec (although the app load hasn't seen any change)
- increased number of idle sessions
- strange blocking events between sessions that never displayed this behavior (even read uncommitted sessions were causing blocking)
- top waits for the interval were non page latch on 1st place, with locks taking 2nd place
Initial investigation:
- using sp_whoIsActive we saw that a query executed by our monitoring tool decides to run extremely slow and grab lots of CPU, something that didn't happen before;
- its isolation level was read uncommitted;
- we looked at the plan we saw wacky numbers: StatementEstRows="3.86846e+010" with some 150 TB of estimated data to be returned
- we suspected a query monitor feature of the monitoring tool was the cause, so we disabled the feature (we also opened a ticket with our provider to check if they're aware of any issue)
- from that first event, it happened a few more times, with every time we kill the session, everything goes back to normal;
- we realize the query is extremely similar to one of the queries used by MS in BOL for Query Store monitoring - Queries that recently regressed in performance (comparing different points in time)
- we run the same query manually and see the same behavior (CPU used ever increasing, increasing latch waits, unexpected locks.. etc)
Guilty query:
Select qt.query_sql_text,
    q.query_id,
    qt.query_text_id,
    rs1.runtime_stats_id AS runtime_stats_id_1,
    interval_1 = DateAdd(minute, -(DateDiff(minute, getdate(), getutcdate())), rsi1.start_time),
    p1.plan_id AS plan_1,
    rs1.avg_duration AS avg_duration_1,
    rs2.avg_duration AS avg_duration_2,
    p2.plan_id AS plan_2,
    interval_2 = DateAdd(minute, -(DateDiff(minute, getdate(), getutcdate())), rsi2.start_time),
    rs2.runtime_stats_id AS runtime_stats_id_2
From sys.query_store_query_text AS qt
Inner Join sys.query_store_query AS q
    ON qt.query_text_id = q.query_text_id
Inner Join sys.query_store_plan AS p1
    ON q.query_id = p1.query_id
Inner Join sys.query_store_runtime_stats AS rs1
    ON p1.plan_id = rs1.plan_id
Inner Join sys.query_store_runtime_stats_interval AS rsi1
    ON rsi1.runtime_stats_interval_id = rs1.runtime_stats_interval_id
 Inner Join sys.query_store_plan AS p2
    ON q.query_id = p2.query_id
Inner Join sys.query_store_runtime_stats AS rs2
    ON p2.plan_id = rs2.plan_id
Inner Join sys.query_store_runtime_stats_interval AS rsi2
    ON rsi2.runtime_stats_interval_id = rs2.runtime_stats_interval_id
Where rsi1.start_time > DATEADD(hour, -48, GETUTCDATE())
    AND rsi2.start_time > rsi1.start_time
    AND p1.plan_id <> p2.plan_id
    AND rs2.avg_duration > rs1.avg_duration * 2
Order By q.query_id, rsi1.start_time, rsi2.start_time
Settings and info:
- SQL Server 2016 SP1 CU4 Enterprise on a Windows Server 2012R2 cluster
- Query Store enabled and configured as default (no setting changed)
- database imported from a SQL 2005 instance (and still at compatibility level 100)
Empirical observation:
- due to extremely wacky stats, we took all *plan_persist** objects used in the bad estimated plan (no actual plan yet, cause the query never finished) and checked statistics, some of the indexes used in the plan didn't have any statistics (DBCC SHOWSTATISTICS didn't return anything, select from sys.stats showed NULL stats_date() function for some indexes
Quick and dirty solution:
- manually create missing statistics on system objects related to Query Store or
- force the query to run using the new CE (traceflag) - which will also create/update the necessary stats or
- change the database's compatibility level to 130 (so it will by default use the new CE)
So, my real question would be:
Why would a query on Query Store cause performance problems on the entire instance? Are we in a bug territory with Query Store?
PS: I'll upload some files (print screens, IO stats and plans) in a short bit.
Files added on Dropbox.
Plan 1 - initial wacky estimated plan in production
Plan 2 - actual plan, old CE, in a testing env (same behavior, same wacky stats)
Plan 3 - actual plan, new CE, in a testing env

