1

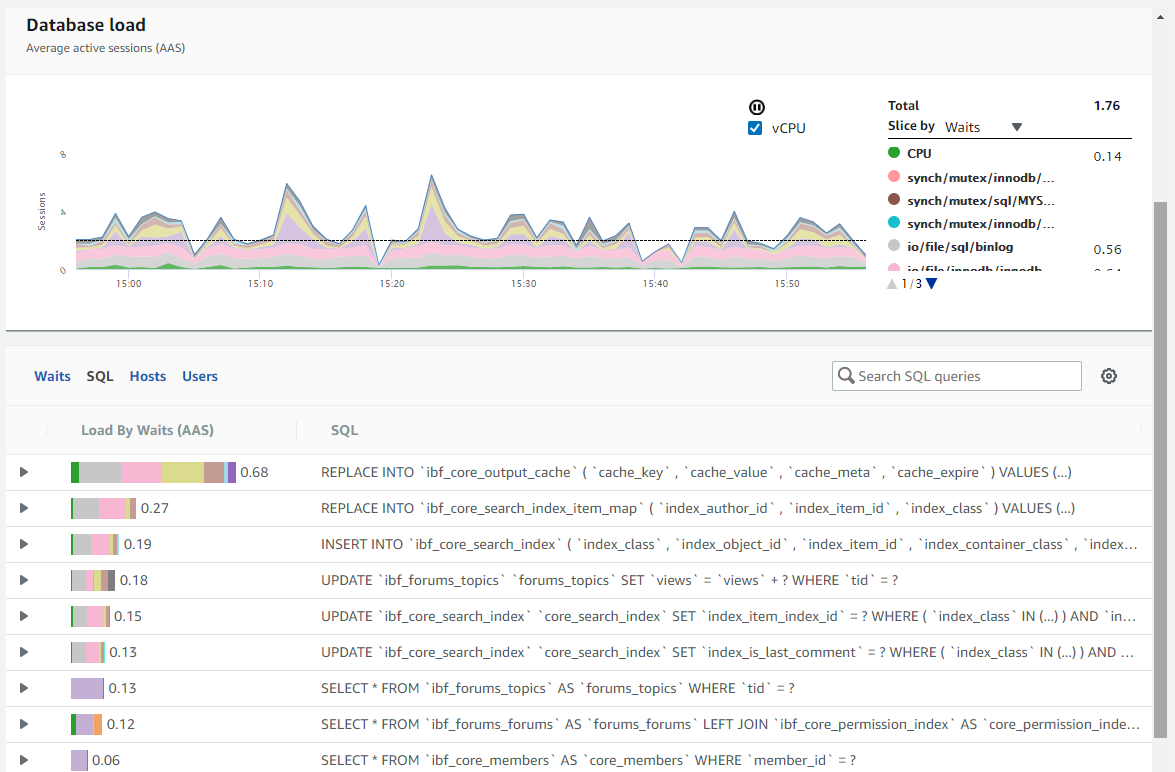
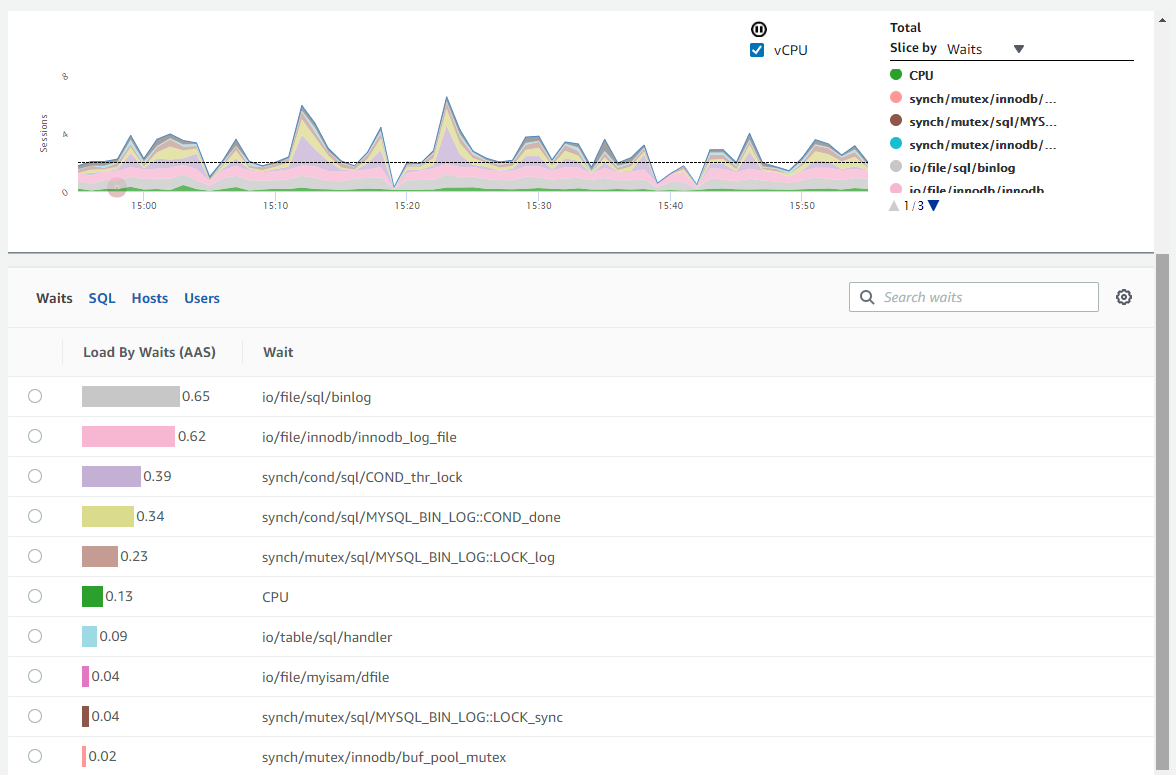
I just migrated my forums application to AWS. I'm in the middle of tweaking things for performance and I noticed that the number of sessions for my RDS instance (t3.large) is consistently exceeding 2.0. At first there was a bad query that was writing way too much, but now that I've eliminated that, I can't figure out what's going on here. Here's some screenshots of the performance insights:

Load By Waits

Load By Waits SQL Queries

It looks like there's something going on with the binlog and innodb_log_file that is causing some of the sessions to block, but I'm unclear how to fix this. I've tried increasing the log file size from the default, but I'm not sure what else to do.

One thing to note is that my CPU usage on this RDS instance is very, very low, despite constant usage.

1 Answer 1

2

In addition to what was already stated, I took a look at the amount of freeable RAM on the instance. My RAM useage was also very good, with plenty of usable RAM.

The waits shown in the images are log file related -- the only thing that really should affect those is your disk IO. So begun the hunt: my CloudWatch metrics were showing a high number of writes (about 230 per second) and a very low number of reads (1 to 2 per second). That was somewhat of a surprise, but it turned out there was some index rebuilding that was being done on a table with over 5 million rows in it.

From this point, I started wondering what my limit on IOPS was for my RDS instance. As it turned out, I was using general storage, not provisioned IOPS, and in AWS General Storage IOPS baseline is about 3 IOPS per GB. Since my database was large but not enormous, I had only selected 50GB of General SSD storage. That means that my disk operations were limited to only about 150 IOPS for baseline. There are burst IOPS, up to 3000 IOPS for about 30-35 minutes, but I had already depleted this and wasn't aware that I needed to monitor these credits in CloudWatch to know when I might start getting throttled.

In the end, I increased the size of my RDS Storage and the problem immediately subsided.

3
  • Additional information request. Post on pastebin.com and share the links. RAM size of your MySQL Host server A) complete (not edited) my.cnf or my.ini Text results of: B) SHOW GLOBAL STATUS; after minimum 24 hours UPTIME C) SHOW GLOBAL VARIABLES; D) SHOW FULL PROCESSLIST; E) complete MySQLTuner report AND Optional very helpful information, if available includes - htop OR top OR mytop for most active apps, ulimit -a for a linux/unix list of limits, iostat -xm 5 3 for IOPS by device and core/cpu count, for server workload tuning analysis. Commented Jun 3, 2019 at 16:02
  • Hey Wilson -- I can't actually provide some of this information because this is an RDS instance and I can't exactly just SSH into it. Further, I've since found other issues and fixed them, so the conditions under which this was occurring no longer exist. Among these issues were: some of my large tables were using MyISAM instead of InnoDB and my RDS instance only had 4GB of RAM and had started to use Swap memory, which increased the amount of disk IO used.
    – Jyosua
    Commented Jun 5, 2019 at 21:05
  • Please provide what you have available, we will analyze available data for you. How big is your SWAP space? Commented Jun 5, 2019 at 21:31

Your Answer

By clicking “Post Your Answer”, you agree to our terms of service and acknowledge you have read our privacy policy.

Not the answer you're looking for? Browse other questions tagged or ask your own question.