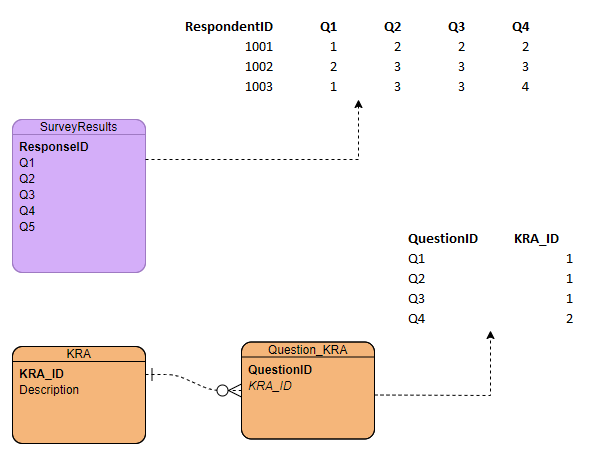
I am building a database to feed into a PowerBI dashboard.
The data is extracted as CSV (SurveyResults) from Survey Monkey which will be loading into the MSSQL database.
The outcome i am after is the ability to provide an Average for each KRA.
The response table has a unique row for each survey response, with each question as a separate column, with a score for a value.
Each Question is assigned a KRA, so i have created the lookup table (Question_KRA).
can someone point me in the right direction in how i can structure the data in order to have a summary table which describes the KRA and the average?
I would like to avoid hard coding in a view, as i would like the ability to add in new questions, with relative ease.

