3

In my organisation Ricoh is the supplier of printers and copiers. Papercut is used for registering which copies are made and for which account. Another application working with Ricoh is registering copies in a different database, but both are somewhat linked.

My organisation wanted a central place to retrieve the total cost so I wrote some queries. Most work fine, but something weird is going on with the one below and I'm unable to figure out why this is failing. What could be the reason of the following issue.

It's hard to make a db<>fiddle as the databases are quite complicated. I'll try to explain the issue here.

In essence there are two main tables. A table maintained by Ricoh containing client identifiers ClientId, a price (cost of the copywork), print timestamps and a job identifier. The table maintained by Papercut also has a timestamp, a printed flag and a reference to the corresponding JobId in its job_comment.

Now consider the following query which gives the total printcost when having printed using the seperate Ricoh application.

SELECT CliendId,
       SUM(ricoh.price) AS cost
FROM
  (SELECT a.SystemId as ClientId,
          a.ProcessInternalUid as JobId,
          a.price
   FROM   ricoh.printhistory AS a
   WHERE a.Exportdate >= '2020-10-01'
     AND a.Exportdate <= '2020-12-12') AS ricoh
INNER JOIN
  (SELECT substring(b.job_comment, 16, 36) AS JobId
   FROM  papercut.printer_usage_log AS b
   WHERE b.usage_date >= '2020-10-01'
     AND b.usage_date <= '2020-12-12'
     AND b.printed = 'Y'
   GROUP BY substring(b.job_comment, 16, 36)) AS papercut ON (papercut.JobId = ricoh.JobId)
GROUP BY ricoh.CliendId

If I run this query I have instant results, where the subqueries ricoh and papercut have 96.321 and 9.354 rows respectivly.

But if I change the lower bound of the date range to 2020-11-01 the query takes 49 minutes (!). While the subqueries have 46.223 and 4.547 records respectivly.

How can this be? How can a join with larger subqueries result in much faster results? I'm really puzzled by this. What could be a reason for this increase in time? (Then I can try to debug further)

I've done some (initial) debugging and noticed the following:

  • There is a limit date. If I set the lower bound to anything higher then 2020-10-08, the execution time gets large. I went looking for some troublesome records with that timestamp but found none. Also, choosing any date higher, like even 2020-12-01 results in high execution times.
  • If I remove the GROUP BY aggregation (and the sum) execution is instantaneous. But if I add an ORDER BY ricoh.price then execution time rises again. Could something with the price be an issue? It's a floating point number. I tried converting it to an integer but the issues remains.

EDIT:

Added the execution plans as requested by user J.D. I'm not really that familiar with these plans. I would guess the main difference is that Hash Match?

Also, this query is running on SQL server 2012. And since the database is managed by external firms I cannot add indexes. Is there a way to rewrite the query to force the 'fast' execution plan?

0

2 Answers 2

3

Almost guaranteed what you're experiencing is a change in the Execution Plan to cause a different operation (e.g. an Index Scan instead of Index Seek) to occur because there's a different cardinality for the data being returned for one date range vs the other.

Cardinality is the uniqueness of results being returned from the tables being queried. SQL Server's Engine uses cardinality to determine what types of operations are best to use when finding and serving up the data. Then it generates an Execution Plan which is the full set of operations it needs to undertake to serve the data.

The cardinality is determined off of the predicates that you use in your WHERE, JOIN, and HAVING clauses.

For example, say you have a table of Cars with 10 records and the column Manufacturer, and of those 10 records 8 of them have the Manufacturer set to "Honda" and 2 of them are set to "BMW". "BMW" is a lot more unique of a value in the table than "Honda" is. Therefor an Index Seek is a much more performant operation to find and serve the data if your query was to do a search WHERE Manufacturer = 'BMW'. But "Honda" is a lot more common of a value in the Cars table and if you changed your query to WHERE Manufacturer = 'Honda' then an Index Scan operation would be more performant (and the Execution Plan to get the data would change). This is how it works for all types of columns (dates, ints, floats, etc).

SQL Server stores statistics on these values to help determine the cardinality but sometimes it makes misestimations of the cardinality when serving the data which results in sub-optimal execution plans. Without seeing your execution plans specifically, this is the best we can speculate what the issue is, but it seems very likely it's a cardinality estimate issue.

The big takeaway is that the amount of data being returned isn't the only thing that affects performance of a query, and actually more times than not it's not the reason for bad performance. There's a lot more things that happen under the hood of the engine when serving up the data.


Per your updated question, here's some additional information related to the aforementioned paragraphs.

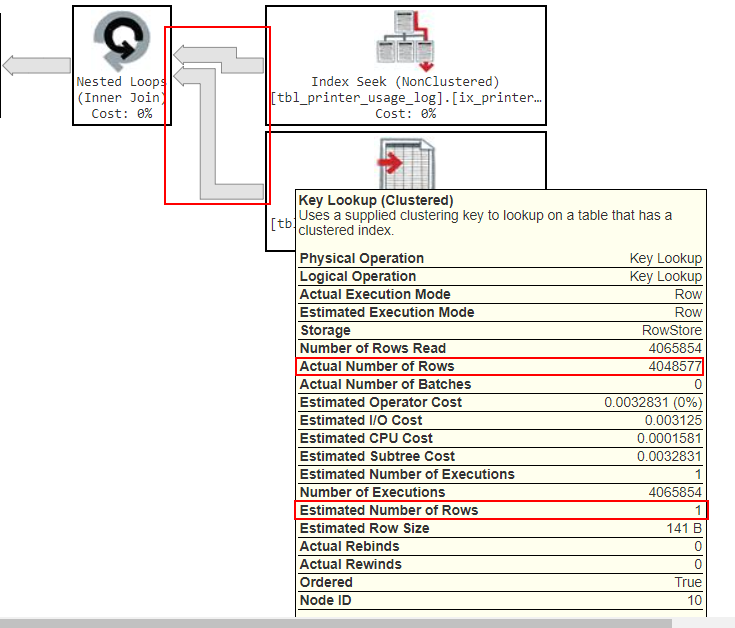
Here's the most relevant piece of your slow query's execution plan: Slow Execution Plan.

Notice how the arrows are a lot fatter here, that's because the actual amount of data returned at this step is a lot more than what was previously being returned at this step. But again don't get stuck on the amount of data, the bigger issue is if you look at the "Actual Number of Rows", it's returning 4,048,577 rows but under the "Estimated Number of Rows" it thought it was only going to be returning 1 row. This is where the cardinality estimate issue I mentioned is occurring. (These two numbers can be off by a little bit, but generally if they're off by a magnitude or more, than that's a clear problem with the cardinality estimate.)

One reason a cardinality estimate issue like this causes performance problems is because they cause the engine to request the wrong amount of hardware resources to serve the data. I.e. by under-estimating the number of rows this step will return by so much, it's could severely under-request Memory and CPU needed to process this operation.

One thing that can cause cardinality estimate issues to occur is when functions are used as predicates in the JOIN, WHERE, and HAVING clauses. After reviewing your query closer, I see that you're using SUBSTRING() to get a value that represents the JobId from the papercut.printer_usage_log table, and then joining to that value outside the subquery when you do ON (papercut.JobId = ricoh.JobId). This is likely the source of your cardinality estimate issue. If you have another way to obtain the JobId that doesn't involve using a function (or at least you can try an alternative function) then you might be able to resolve your issue.


You can try this logically equivalent query re-write to see if it gives you a better execution plan. The only downside is it's not a single-statement query anymore and leverages TempDB. I'm not sure what's ultimately consuming your query (View, Stored Procedure, Report / Application?) so there might be some limitations that prevent you from doing this, but if not, then this might solve your problem:

-- Materializing your logic for Ricoh and Papercut into their own TempTables
SELECT 
    a.SystemId as ClientId,
    a.ProcessInternalUid as JobId,
    a.price
INTO #Ricoh
FROM ricoh.printhistory AS a
WHERE a.Exportdate >= '2020-10-01'
    AND a.Exportdate <= '2020-12-12'

-- This materializes the SUBSTRING() function call's results to a TempTable so that when we join on JobId later on, we're not joining by a function call rather we're joining by the actual value itself
SELECT SUBSTRING(b.job_comment, 16, 36) AS JobId 
INTO #Papercut
FROM  papercut.printer_usage_log AS b
WHERE b.usage_date >= '2020-10-01'
    AND b.usage_date <= '2020-12-12'
    AND b.printed = 'Y'
GROUP BY SUBSTRING(b.job_comment, 16, 36)

-- Indexing the aforementioned temp tables
CREATE CLUSTERED INDEX IX_Ricoh_JobId ON #Ricoh (JobId)
CREATE CLUSTERED INDEX IX_Ricoh_JobId ON #Papercut (JobId)

-- Final select
SELECT 
    #Ricoh.CliendId,
    SUM(#Ricoh.price) AS cost
FROM #Ricoh
INNER JOIN #Papercut 
    ON (#Papercut.JobId = #Ricoh.JobId)
GROUP BY #Ricoh.CliendId

If you are able to use this multi-statement query, then let me know how it works out and you can also upload the new execution plan for our references.

I'm still analyzing the differences between your execution plans and will advise a solution soon.


To view the Execution Plan you can enable it in SQL Server Management Studio like so (and then run your query):

Enable Actual Execution Plan

5
  • @dietervdf Great! No problem! If you want to update your post with the new execution plan, I'd be curious to look it over to see how it changed and could explain why it improved. But if not, no biggie. You can try using a CTE too if you want something a little "cleaner" and it might help because any query rewrite can result in a different execution plan, but it's possible it might not help too because of your Cardinality Estimate issue. CTEs are almost exactly like subqueries in nature for the fact that they don't materialize the data where as TempTables does materialize the data.
    – J.D.
    Commented Dec 16, 2020 at 15:27
  • @dietervdf Also any other questions, feel free, and I'll do my best to explain. I probably clean up this answer and structure it a little better now that we got through the end of the tunnel. :)
    – J.D.
    Commented Dec 16, 2020 at 15:28
  • For Nested Loops the Actual and Estimated are different. Actual Rows is the total actual for the query, but Estimated Rows is just per execution, you need to multiply by the number of Estimated Executions. Admittedly, that is equal to 1 in this case so it makes little differences Commented Dec 27, 2020 at 16:10
  • @Charlieface Yes, true. I'm used to SentryOne's Plan Explorer which does the math for you and displays it in a little more intuitive manner.
    – J.D.
    Commented Dec 27, 2020 at 16:15
  • Can I suggest you edit your answer to show that? I'm not about to try with that screenshot. Commented Dec 27, 2020 at 20:42
4

Executon Plans

Reasons for different execution plans and/or different duration of execution plans can be because of different search predicates (aka WHERE clauses). This is what you have already observed.

When you change the WHERE clause and if the query isn't parameterised, then SQL Server's Query Optimizer will try and create a new best execution plan based on the information provided in the query.

To achieve the best execution plan, the Query Optimizer will have a peak at the statistics of the indexes/columns that could possibly be involved in the future execution plan and based on the information (data histogram) that is available in the statistics, the Query Optimizer will choose one or the other index.

That is a very short explanation on how SQL Server goes about creating an optimal execution plan based on the statistics.

Now what can impact the creation of a not so optimal execution plan?

If the data in the statistics are old or outdated or haven't been automatically updated, because the trigger value of the automatic statistics updated hasn't been reached, then the Query Optimizer could assume that an index is better than another and make a bad choice.

Trigger values for automatic statistic updates are when the following number of data rows have changed:

  • older than SQL Server 2016 : 20% of total rows changed + 500 rows
  • SQL Server 2016 or newer : Square Root (1000 * number of rows changed)

Reference: Statistics (Microsoft | SQL Docs)

Your Execution Plans

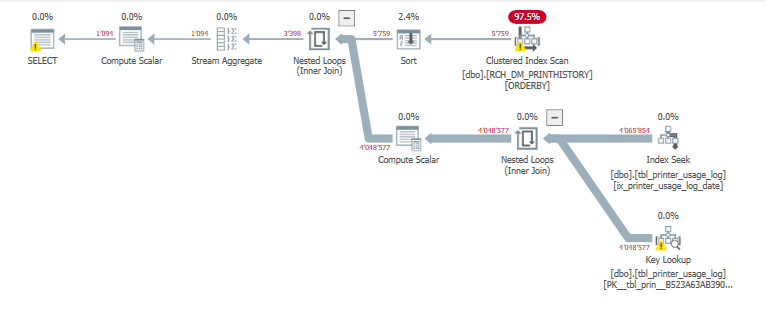
I took the liberty of having a look at your execution plans in SentryOne's Plan Explorer (free as in free beer, highly recommended, not affiliated). The advantage is that the tool displays the amount of rows for each branch of the execution.

Good Plan

Printer SELECT fast execution plan

Bad Plan

Printer SELECT slow execution plan

Observations

The execution plans are basically the same. It's just that the Clusterd Index Scan on [dbo].[RCH_DM_Printhistory] in the bad/slow plan is at the beginning and in the good/fast plan this step is performed later on.

Good Plan

If you have a look at the red number just above the lines, you will note for the good plan, that the query retrieves:

  • 2'874 rows from Nested Loop part
  • 14'808 rows from the Clustered Index Scan

The Query Optimizer only has to compare 2'874 rows with 14'808 rows which is pretty fast.

Bad Plan

If you have a look at the number for the bad plan, then the query has to retrieve:

  1. 5'759 rows from the Clustered Index Scan
  2. 4'048'577 rows from the Nested Loop part

In the bad plan the query optimizer has to compare 5'759 rows with 4 Mio rows, which is going to be slow anyway.

The Query Optimizer normally creates a plan that has tables/indexes with lower row numbers at the beginning in order to reduce the amount of data it has to compare with other tables later on in the execution plan.

Generally the execution plans seem to be the best possible execution plans for your statements.

Estimated Rows and Statistics

As pointed out by others the amount of rows estimated is always 1 compared to the actual amount of rows retrieved. This is bad, because it means the Queryy Optimizer is relying on statistics that contain the wrong information on the amount of distributed values in the indexes or relying on statistics that only have scanned a certain amount of data in the table(s).

Possible Solutions

(See script at end of post for retrieving pre-formatted statements and information on trigger level for status updates)

  1. Update the statistics for the Clustered Index ORDERBY on the table [dbo].[RCH_DM_PRINTHISTORY]. You can retrieve the statements to update the statistics from my query at the end of the post.

  2. Ensure Auto Update Statistics has been turned on for your database(s).

    SELECT sdb.name, 
           sdb.is_auto_create_stats_on, 
           sdb.is_auto_update_stats_on, 
           sdb.is_auto_update_stats_async_on 
    FROM sys.databases AS sdb
    

    The value for is_auto_update_stats_on should be 1.

  3. Ensure Auto Create Statistics has been truned on for your database(s).

    SELECT sdb.name, 
           sdb.is_auto_create_stats_on, 
           sdb.is_auto_update_stats_on, 
           sdb.is_auto_update_stats_async_on 
    FROM sys.databases AS sdb
    

    The value for is_auto_create_stats_on should be 1.

  4. Create the missing indexes mentioned in the execution plans. Be wary though. Sometimes the so-called "Missing Indexes" are already available. Test in a non-productive environment.

  5. Re-write the query using temporary tables or CTEs.

Statement to Retrieve Statistics Information

SELECT 'DBCC SHOW_STATISTICS ([' + [sch].[NAME] + '.' +[so].[NAME] + '] , [' + [ss].[NAME] + ']) WITH STAT_HEADER'       AS [SHOW_STATISTICS],
       'update statistics ' + [sch].[name] + '.' + [so].[name] + ' ' + [ss].[name] + ' WITH FULLSCAN'                    AS [UPDATE_STATISTICS] -- PAGECOUNT=100, ROWCOUNT=100 | FULLSCAN
       'DBCC UPDATEUSAGE(' + DB_NAME() + ', ''' + [sch].[NAME] + '.' +[so].[NAME] + ''')'                                AS [UPDATE_USAGE],
       [sch].[name] + '.' + [so].[name]                        AS [TableName],
       [ss].[name]                                             AS [Statistic],
       [sp].[last_updated]                                     AS [StatsLastUpdated],
       [sp].[rows]                                             AS [RowsInTable],
       [sp].[rows_sampled]                                     AS [RowsSampled],
       [sp].[modification_counter]                             AS [RowModifications],
       100 / (1.0 * [sp].[rows]) * [sp].[modification_counter] AS [PercentChanged],
       SQRT(1000 * [sp].[rows])                                AS [> 2014 Algorithm Change Value],
       CASE 
            WHEN SQRT(1000 * [sp].[rows]) < [sp].[modification_counter] THEN 1
            ELSE 0
       END                                                     AS [Auto Update > 2014 Triggered],
       [sp].[rows] * 1.0 / 100 * 20 + 500                      AS [<=2014 Algorithm Change Value],
       CASE 
            WHEN [sp].[rows] * 1.0 / 100 * 20 + 500 < [sp].[modification_counter] THEN 1
            ELSE 0
       END                                                     AS [Auto Update <= 2014 Triggered]
FROM   [sys].[stats] [ss]
       JOIN [sys].[objects] [so]
            ON  [ss].[object_id] = [so].[object_id]
       JOIN [sys].[schemas] [sch]
            ON  [so].[schema_id] = [sch].[schema_id]
       OUTER APPLY [sys].[dm_db_stats_properties]([so].[object_id], [ss].[stats_id]) sp
WHERE  1 = 1
       AND [so].[type] = 'U'
           -- AND [sp].[modification_counter] > 0
           -- AND 100/(1.0*[sp].[rows])*[sp].[modification_counter] < 10.0     -- maximum percentage change (certain tables have a high volatility)
           -- AND 100/(1.0*[sp].[rows])*[sp].[modification_counter] > 0.001    -- minimum percentage change (we aren't going to be looking at statistics with a very low percentage of change)
           -- AND [sp].[rows] > 1000000                                        -- only look at statistics which contain more than 1'000'000 rows.
           -- AND [sp].[last_updated] < dateadd(hh,-1,getdate())               -- only look at statistics which have been updated more than an hour ago
       AND [sch].[name] = 'dbo'
       AND [so].[name] = 'RCH_DM_PRINTHISTORY'
       -- AND [ss].[name] NOT LIKE '_WA_Sys%'                                  -- Exclude automatically create statistics
       -- AND [ss].[name] not like '_dta_stat%'                                -- Exclude statistics crete by the Database Tuning Advisor
       -- AND (SQRT(1000 * [sp].[rows]) < [sp].[modification_counter] OR [sp].[rows] * 1.0 / 100 * 20 + 500 < [sp].[modification_counter])
ORDER BY
       [sch].[name] + '.' + [so].[name] ASC,
       [ss].[name] ASC,
       [sp].[last_updated] DESC;

This statement is pre-configured for the RCH_DM_PRINTHISTORY table mentioned in this question. Change the value for [so].[name] to search different tables.

0

Your Answer

By clicking “Post Your Answer”, you agree to our terms of service and acknowledge you have read our privacy policy.

Not the answer you're looking for? Browse other questions tagged or ask your own question.