Executing the query from here to pull the deadlock events out of the default extended events session
SELECT CAST (
    REPLACE (
        REPLACE (
            XEventData.XEvent.value ('(data/value)[1]', 'varchar(max)'),
            '<victim-list>', '<deadlock><victim-list>'),
        '<process-list>', '</victim-list><process-list>')
    AS XML) AS DeadlockGraph
FROM (SELECT CAST (target_data AS XML) AS TargetData
    FROM sys.dm_xe_session_targets st
    JOIN sys.dm_xe_sessions s ON s.address = st.event_session_address
    WHERE [name] = 'system_health') AS Data
CROSS APPLY TargetData.nodes ('//RingBufferTarget/event') AS XEventData (XEvent)
    WHERE XEventData.XEvent.value('@name', 'varchar(4000)') = 'xml_deadlock_report';
takes about 20 minutes to complete on my machine. The stats reported are
Table 'Worktable'. Scan count 0, logical reads 68121, physical reads 0, read-ahead reads 0,
         lob logical reads 25674576, lob physical reads 0, lob read-ahead reads 4332386.

 SQL Server Execution Times:
   CPU time = 1241269 ms,  elapsed time = 1244082 ms.
If I remove the WHERE clause it completes in less than a second returning 3,782 rows.
Similarly if I add OPTION (MAXDOP 1) to the original query that speeds things up too with the stats now showing massively fewer lob reads.
Table 'Worktable'. Scan count 0, logical reads 15, physical reads 0, read-ahead reads 0,
                lob logical reads 6767, lob physical reads 0, lob read-ahead reads 6076.

 SQL Server Execution Times:
   CPU time = 639 ms,  elapsed time = 693 ms.
So my question is
Can anyone explain what's going on? Why is the original plan so catastrophically worse and is there any reliable way of avoiding the problem?
Addition:
I've also found that changing the query to INNER HASH JOIN improves things to some extent (but it still takes > 3 mins) as the DMV results are so small I doubt that the Join type itself is responsible though and presume something else must have changed. Stats for that
Table 'Worktable'. Scan count 0, logical reads 30294, physical reads 0, read-ahead reads 0,
          lob logical reads 10741863, lob physical reads 0, lob read-ahead reads 4361042.

 SQL Server Execution Times:
   CPU time = 200914 ms,  elapsed time = 203614 ms.
After filling up the extended events ring buffer (DATALENGTH of the XML was 4,880,045 bytes and it contained 1,448 events.) and testing a cut down version of the original query with and without the MAXDOP hint.
SELECT COUNT(*)
FROM   (SELECT CAST (target_data AS XML) AS TargetData
        FROM   sys.dm_xe_session_targets st
               JOIN sys.dm_xe_sessions s
                 ON s.address = st.event_session_address
        WHERE  [name] = 'system_health') AS Data
       CROSS APPLY TargetData.nodes ('//RingBufferTarget/event') AS XEventData (XEvent)
WHERE  XEventData.XEvent.value('@name', 'varchar(4000)') = 'xml_deadlock_report'

SELECT*
FROM   sys.dm_db_task_space_usage
WHERE  session_id = @@SPID
Gave the following results
+-------------------------------------+------+----------+
|                                     | Fast |   Slow   |
+-------------------------------------+------+----------+
| internal_objects_alloc_page_count   |  616 |  1761272 |
| internal_objects_dealloc_page_count |  616 |  1761272 |
| elapsed time (ms)                   |  428 |   398481 |
| lob logical reads                   | 8390 | 12784196 |
+-------------------------------------+------+----------+
There is a clear difference in tempdb allocations with the faster one showing 616 pages were allocated and deallocated. This is the same amount of pages used when the XML is put into a variable too.
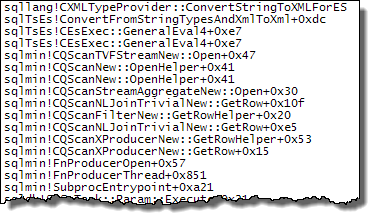
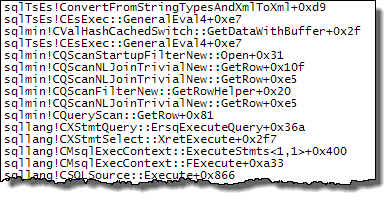
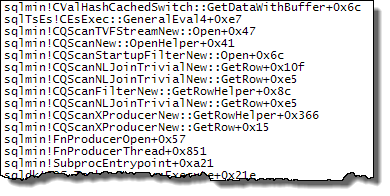
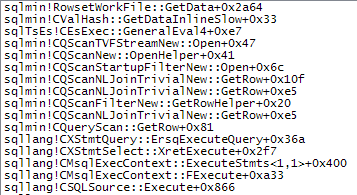
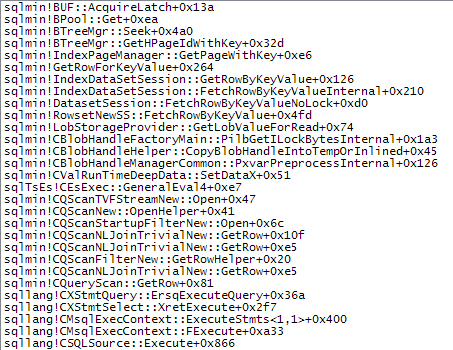
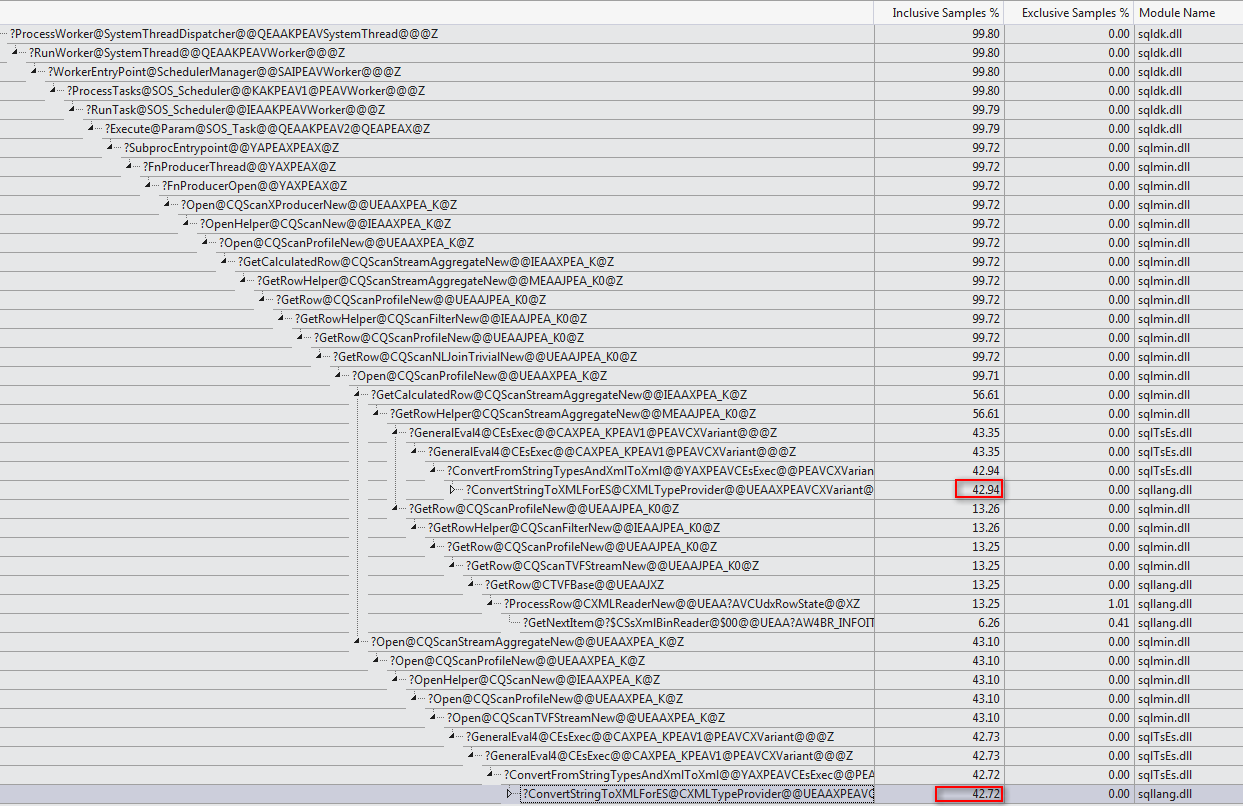
For the slow plan these page allocation counts are into the millions. Polling dm_db_task_space_usage whilst the query is running shows it seems to be constantly allocating and deallocating pages in tempdb with anywhere between 1,800 and 3,000 pages allocated at any one time.

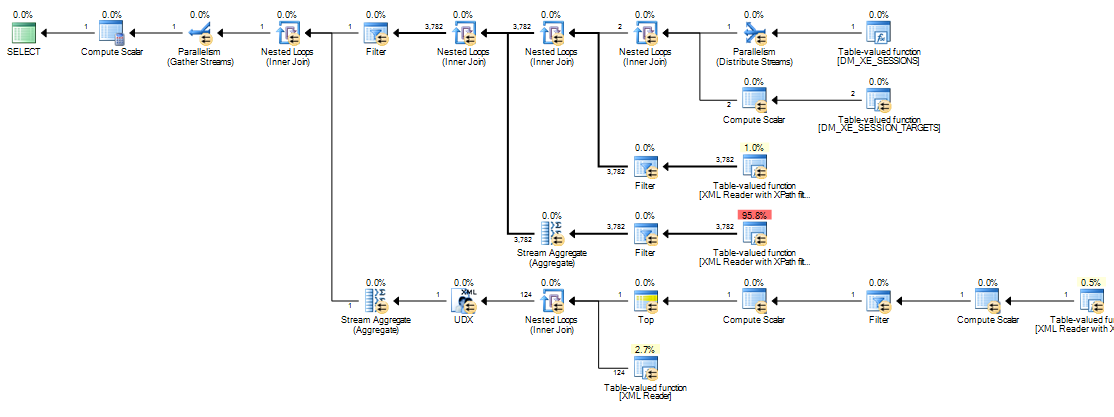
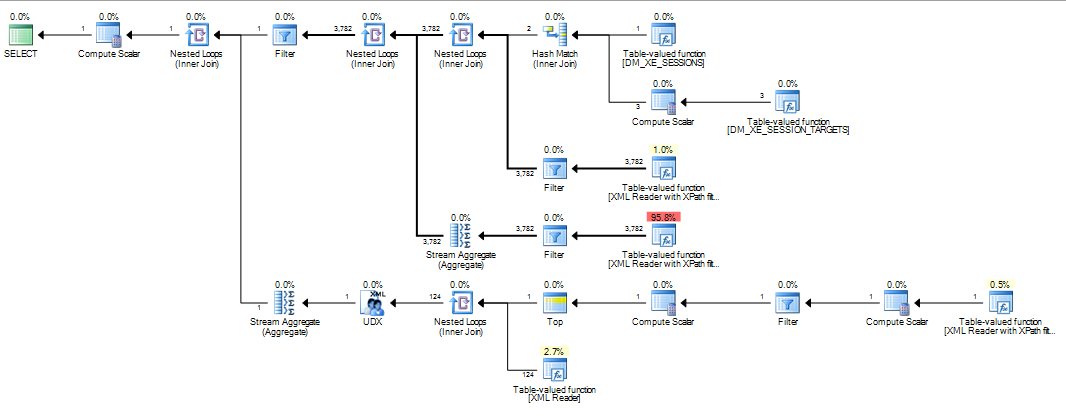
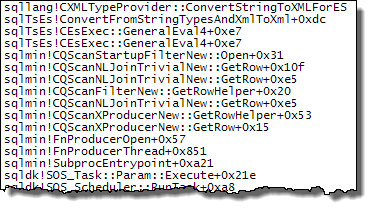
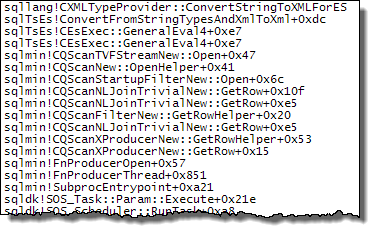


WHEREclause into the XQuery expression; the logic doesn't have to be removed for it to go fast:TargetData.nodes ('RingBufferTarget[1]/event[@name = "xml_deadlock_report"]'). That said, I don't know XML internals well enough to answer the question you've posed.