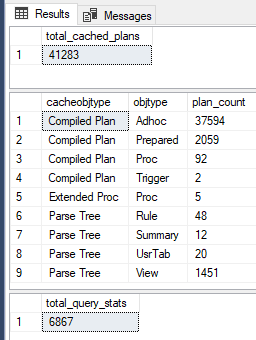
I'm trying to understand some execution plan caching metadata on a SQL Server 2016 SP3 system, and I can't reconcile what I'm seeing with the docs.
The docs for sys.dm_exec_cached_plans say it contains:
a row for each query plan that is cached by SQL Server for faster query execution.
On the system I'm observing, this view has 41,283 rows in it right now. The vast majority of these (37,594 rows) are cacheobjtype = "Compiled Plan" and objtype = "Adhoc".
The docs for sys.dm_exec_query_stats say it contains:
one row per query statement within the cached plan, and the lifetime of the rows are tied to the plan itself. When a plan is removed from the cache, the corresponding rows are eliminated from this view.
I would expect there to be at least 37,594 rows in this view (one per cached plan, potentially more if some of the cached plans have multiple statements). However, this view has 6,867 rows total.
This discrepancy is so great that I must assume that I'm misunderstanding what is supposed to be in these views.
Can someone help me understand why there are so few rows in sys.dm_exec_query_stats compared to sys.dm_exec_cached_plans?
I tried inner joining the tables together on plan_handle, and the only matches were 1:1 - in other words, there are tens of thousands of cached plans with no "query stats" rows.
I also thought the difference might be explained by many rows being in sys.dm_exec_procedure_stats or sys.dm_exec_trigger_stats, but that was not the case (93 and 2 rows, respectively).
For anyone curious about the "why" of this question, I'm trying to see how old the various plans in the cache are, and I'm not sure of a way to do that beyond joining to sys.dm_exec_query_stats and checking creation_time.
Here are the queries I used to get the numbers referenced above:
-- total cached plans
SELECT COUNT_BIG(*) AS total_cached_plans
FROM sys.dm_exec_cached_plans decp

-- totals by type
SELECT decp.cacheobjtype, decp.objtype, COUNT_BIG(*) AS plan_count
FROM sys.dm_exec_cached_plans decp
GROUP BY decp.cacheobjtype, decp.objtype
ORDER BY decp.cacheobjtype, decp.objtype;

-- total query stats
SELECT COUNT_BIG(*) AS total_query_stats
FROM sys.dm_exec_query_stats;
The overwhelming majority of these queries are unparameterized user queries, not system queries. I verified this by sorting by the SQL text (pulled from sys.dm_exec_sql_text). Some examples:
- 5,000 different "INSERT INTO" statements against the same table with different literal values
- 15,000 different "SELECT COUNT(*)" queries with different WHERE clauses
- 15,000 different "UPDATE" statements against a few tables with different literal values
These are all legitimate queries submitted by the applications that connect to this server.

