11

Setup

For this demo, I'm using the 2013 version of the Stack Overflow database, and SQL Server 2022 CTP2, but it is valid going back through SQL Server 2017 which is as far back as I care to check.

Function One

For this function, SQL Server tracks execution time spent in the function:

CREATE OR ALTER FUNCTION
    dbo.ScoreStats
(
    @UserId int
)
RETURNS
    @out table
    (
        TotalScore bigint
    )
WITH SCHEMABINDING
AS 
BEGIN

    INSERT
        @out
    (
        TotalScore
    )
    SELECT
        TotalScore = 
            SUM(x.Score)
    FROM 
    (
        SELECT
            Score = 
                SUM(p.Score)
        FROM dbo.Posts AS p
        WHERE p.OwnerUserId = @UserId

        UNION ALL

        SELECT
            Score = 
                SUM(c.Score)
        FROM dbo.Comments AS c
        WHERE c.UserId = @UserId    
    ) AS x;

    RETURN;

END;

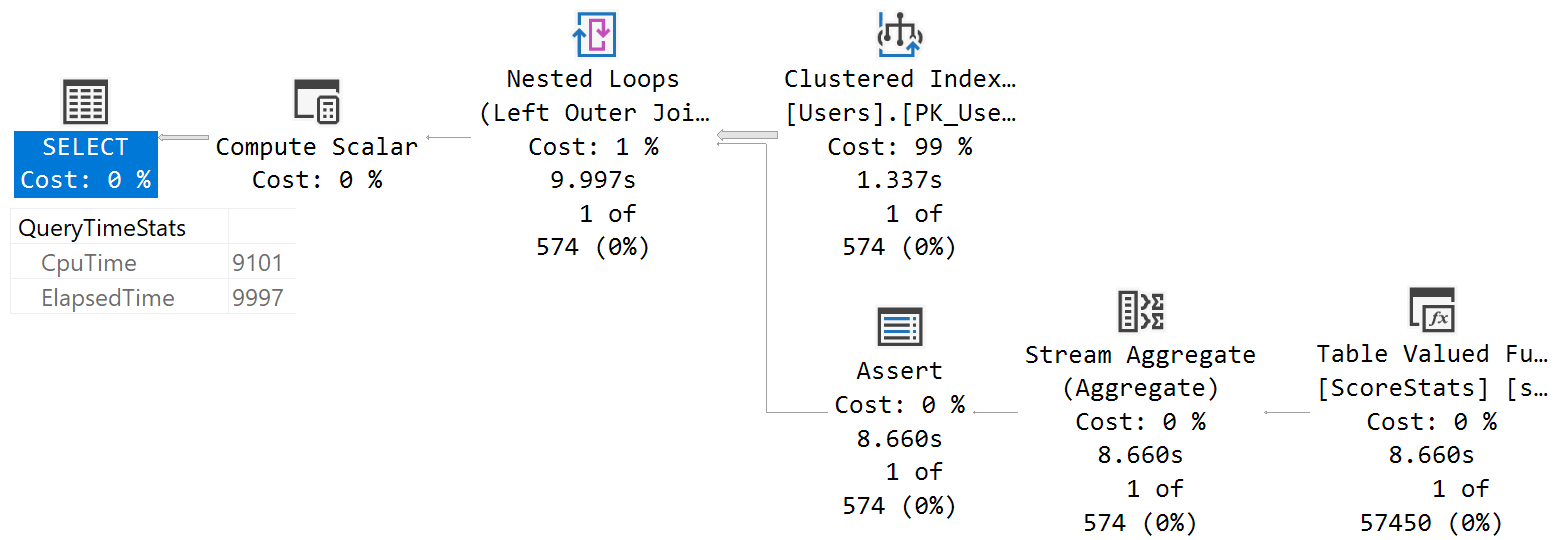
Here's the query and execution plan:

SELECT
    u.DisplayName,
    TotalScore = 
        (
            SELECT
                ss.TotalScore
            FROM dbo.ScoreStats(u.Id) AS ss
        )
FROM dbo.Users AS u
WHERE u.Reputation >= 1000000;

NUTS

You can see that both in the query plan and in the Query Time Stats property, time is tracked accurately.

Function Two

Here's the second function, where that doesn't happen:

CREATE OR ALTER FUNCTION
    dbo.VoteStats()
RETURNS
    @out table
    (
        PostId int,
        UpVotes int,
        DownVotes int,
        UpMultipier AS 
             UpVotes * 2
    )
WITH SCHEMABINDING
AS 
BEGIN

    INSERT
        @out
    (
        PostId,
        UpVotes,
        DownVotes
    )
    SELECT
        v.PostId,
        UpVotes = 
            SUM
            (
                CASE v.VoteTypeId
                     WHEN 2
                     THEN 1
                     ELSE 0
                END
            ),
        DownVotes = 
            SUM
            (
                CASE v.VoteTypeId
                     WHEN 3
                     THEN 1
                     ELSE 0
                END
            )
    FROM dbo.Votes AS v
    GROUP BY 
        v.PostId;

    RETURN;

END;

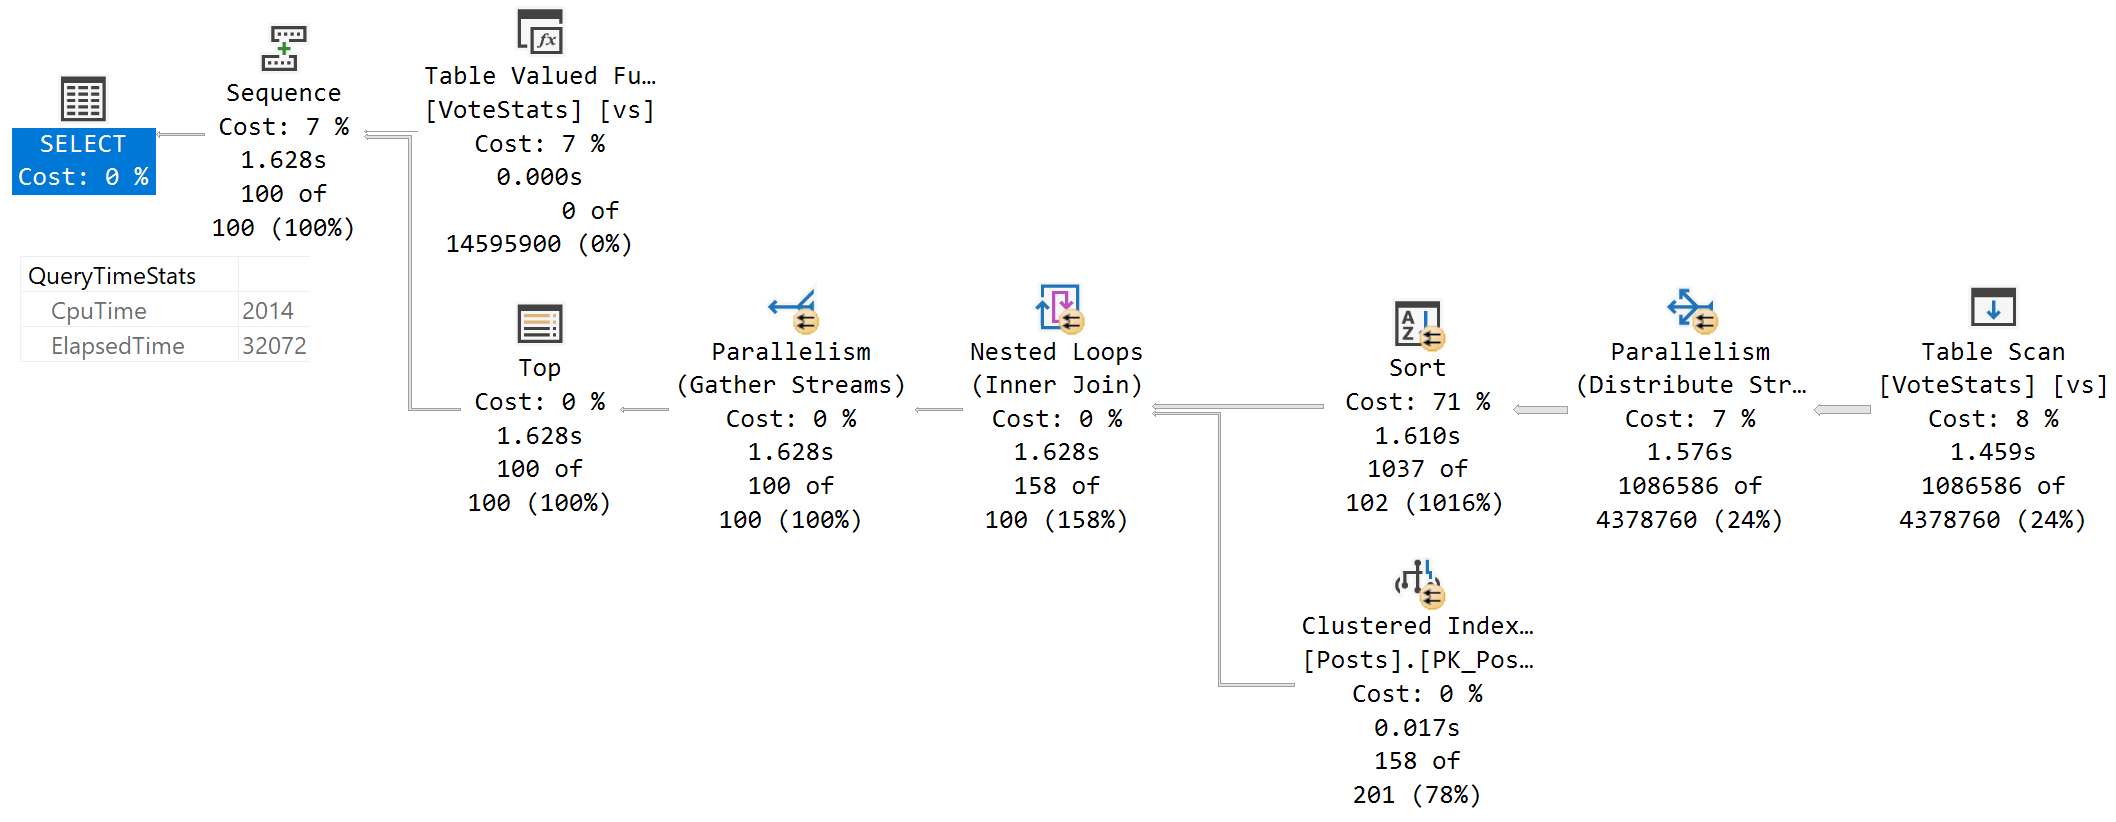
Here's the query and execution plan:

SELECT TOP (100)
     p.Id,
     vs.UpVotes,
     vs.DownVotes
FROM dbo.VoteStats() AS vs
JOIN dbo.Posts AS p
    ON vs.PostId = p.Id
WHERE vs.DownVotes > vs.UpMultipier
AND   p.CommunityOwnedDate IS NULL
AND   p.ClosedDate IS NULL
ORDER BY vs.UpVotes DESC;

NUTS

In this query, time is not accurately tracked in the graphical execution plan, but is tracked in the Query Time Stats property.

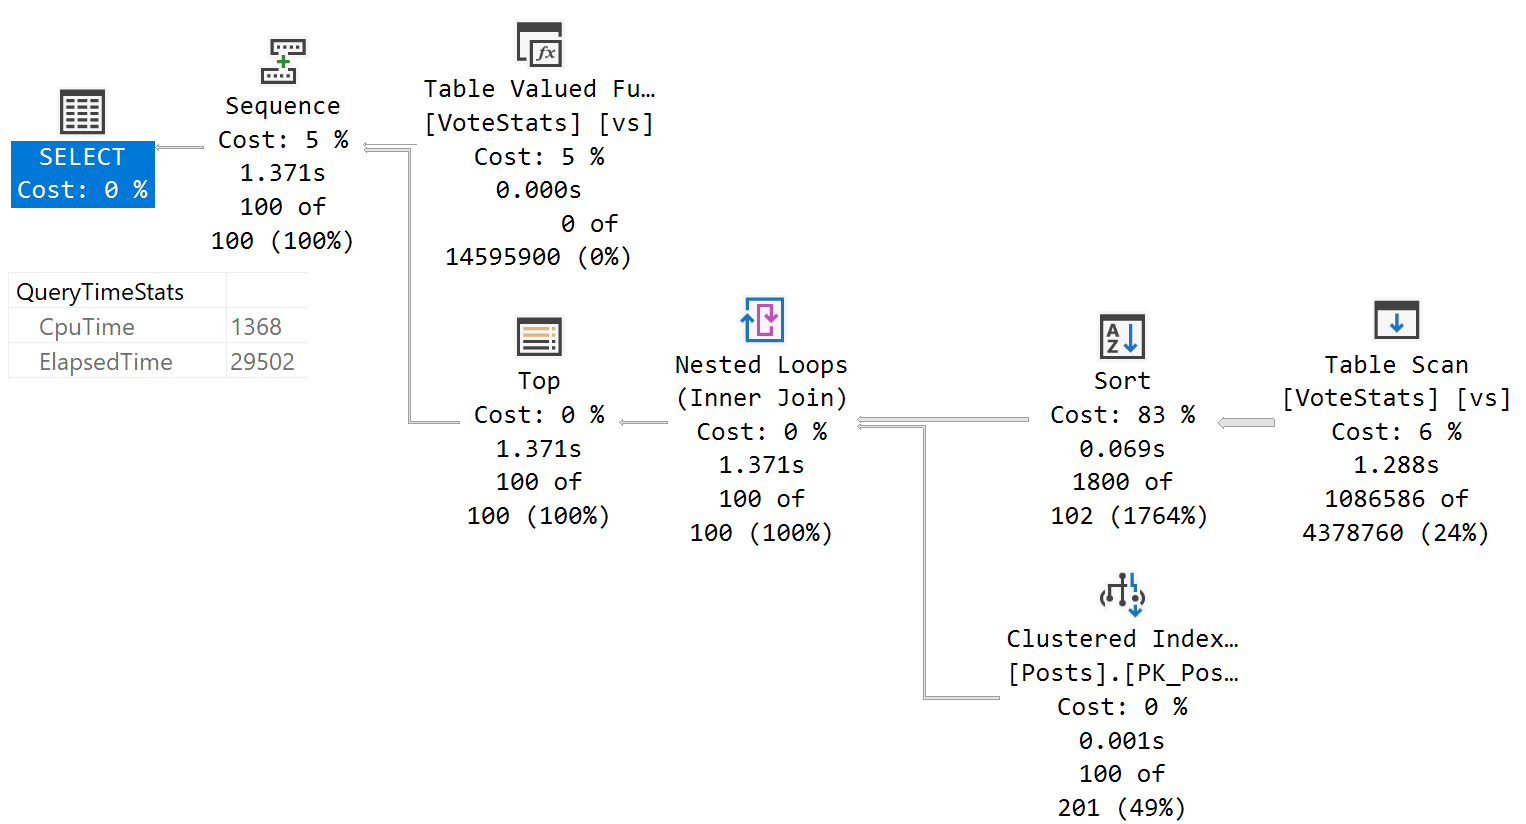
Function Two At MAXDOP 1

Even when forced serial, the time is not accurately tracked:

SELECT TOP (100)
     p.Id,
     vs.UpVotes,
     vs.DownVotes
FROM dbo.VoteStats() AS vs
JOIN dbo.Posts AS p
    ON vs.PostId = p.Id
WHERE vs.DownVotes > vs.UpMultipier
AND   p.CommunityOwnedDate IS NULL
AND   p.ClosedDate IS NULL
ORDER BY vs.UpVotes DESC
OPTION(MAXDOP 1);

NUTS

El Problemo

Back to the question at hand: Why is time tracked in one query plan accurately, but not in the other?

0

2 Answers 2

14

This is a consequence of using interleaved TVF execution.

Interleaved execution changes the unidirectional boundary between the optimization and execution phases for a single-query execution and enables plans to adapt based on the revised cardinality estimates. During optimization if we encounter a candidate for interleaved execution, which is currently multi-statement table-valued functions (MSTVFs), we will pause optimization, execute the applicable subtree, capture accurate cardinality estimates, and then resume optimization for downstream operations.

Your first example does not qualify for interleaved execution, but the second one does. The second example plan's root node has the property:

contains candidates

The TVF population node in the second example has:

is interleaved executed

Running a test query with a hint to disable that feature:

SELECT TOP (1) VS.* 
FROM dbo.VoteStats() AS VS
OPTION (USE HINT ('DISABLE_INTERLEAVED_EXECUTION_TVF'));

Gives a plan including timing for populating the TVF:

plan with timings


This issue only occurs on the first execution of a statement qualifying for interleaved TVF execution. SQL Server executes the TVF population part of the plan to obtain an accurate cardinality estimate during query optimization. The rest of the plan isn't compiled and optimized until after that information has been obtained.

After compilation completes, SQL Server does not repeat the work of populating the table variable for the first execution since this would duplicate work already done (during optimization). Unfortunately, skipping the table population at runtime means performance information for the table variable population is not available in the usual way.

On subsequent executions (where the plan is reused) SQL Server does run the table variable population step as part of regular query execution, so runtime performance numbers show up as expected in showplan output.

If you run your second example again, reusing the cached plan, you will see complete runtime performance information.

Note: This behaviour relates specifically to the interleaved TVF execution feature of Intelligent Query Processing. It is not a consequence of the normal caching behaviour of TVFs as I explain in my self-answered Q & A Does SQL Server cache the result of a multi-statement table-valued function?.

0
-5

Tracking time in parallel executions (exchange operators and child threads) isn't trivial, and can't actually be accurate with current implementation. The other plan is serial, so easy to track accurately. What makes you certain it's about a function? Any rowmode parallel execution will not be accurately tracked per operator (time-wise).

0

Your Answer

By clicking “Post Your Answer”, you agree to our terms of service and acknowledge you have read our privacy policy.

Not the answer you're looking for? Browse other questions tagged or ask your own question.