You should use APPLOCK_MODE and APPLOCK_TEST instead of scanning the locks DMV.
Background
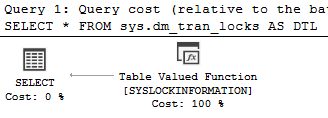
The sys.dm_tran_locks DMV itself employs the widely used streaming table-valued function (sTVF) interface, exposed via T-SQL using the internal-only OPENROWSET(TABLE ... syntax. The interface contains the usual Open, GetRow, and Close methods used for all execution engine iterators.

The sTVF pattern is used by very many system functions and views. How each one initialises and provides row-at-a-time access to the underlying data varies according to the data source.
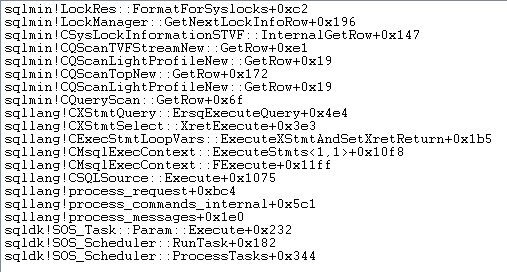
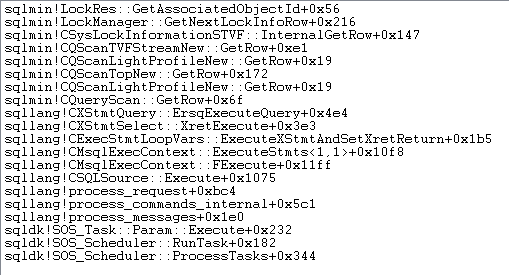
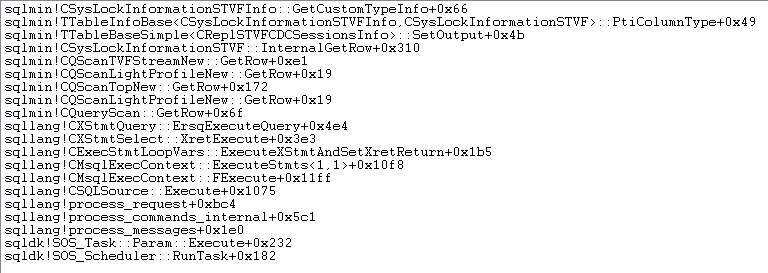
Some example call stacks for this particular DMV below:

open

get row

describe lock owner

logical stability lock

lock resource

associated object id

output column data type
There is also variation around which (if any) parameters supplied to the sTVF can be pushed down into the internal data access. Where pushdown is supported, rows are filtered before being surfaced to the query processor.
Most sTVFs support passing parameters as outer references (e.g. column values provided by an APPLY) but not all. Support for this aspect has improved gradually over several major product versions.
The documentation summarises quite well:
Because sys.dm_tran_locks is populated from internal lock manager data structures, maintaining this information does not add extra overhead to regular processing.
Materializing the view does require access to the lock manager internal data structures. This can have minor effects on the regular processing in the server. These effects should be unnoticeable and should only affect heavily used resources.
Because the data in this view corresponds to live lock manager state, the data can change at any time, and rows are added and removed as locks are acquired and released.
Applications querying this view might experience unpredictable performance due to the nature of protecting the integrity of lock manager structures.
This view has no historical information.

