1

I have a recursive CTE inside a inline table-valued function. The ITVF is returning a list of IDs containing a long sequence of ancestors for a person, it usually loops back about 12 to 18 times before getting to the end. It's quite fast but there's an error in the estimations that stacks when used in on many people, so it becomes extremely slow.

The CTE looks like this

WITH ancestors AS (
  SELECT
    IndID,
    AncestorID
  FROM
    dbo.persons

  UNION ALL

  SELECT 
    IndID,
    AncestorID
  FROM
    ancestors a
    INNER JOIN dbo.persons p ON p.IndID = a.AncestorID
)
SELECT IndID, AncestorID FROM ancestors

I have a dozen million rows so it's quite a large table. When I ask for one IndID, the execution plan says that it estimated 7 rows but got 1300 actual rows. For a single request it's acceptable (runs in less than a second) but if I join it in an other request so it gets called, let's say 100 times, the speed drops to a crawl since the estimation is getting worse and worse.

Just to be clear, the estimation error is present even out of the IVTF. I only specified it to be clear that I can't just use a temporary table. It needs to stay in a IVTF so I can join it in larger, more complex requests and it stays parallelable. What can I do to estimate the rows better?

Update : Paste The Plan

Update 2 : Less simplified

I'm kind of stuck between two problems. Either I use a MSTVF and all my queries can't parallelize, or I use an ITVF and hope that the SQL gods are generous and don't horribly underestimates the row counts so everything now swaps on the hard drive instead of RAM. I hope that it's just that I'm dumb and it's a stupid easy fix somewhere.

Update 3 To answer to the best of my knowledge to the questions asked.

uno) Updated to the latest cumulative update. Didn't change anything as expected, but it's good to be up to date as you said :)

dos) We are on Standard edition, but I do have a Column Store and I can't remember why I did it. It's on IndID, FirstNameID, LastNameID. I'll try dropping it, we are only 2 users on the database today, we can manage downtimes if it crashes something else.

After removing the ColumnStore, it did save about 30 seconds! Still slow, but it's better. I'll have to check my notes to find why I did that ColumnStore.

dos: part 2) The "underpowered box" feeling you got is exactly what got me up to now. I tought our machine was underpowered, but after talking with the IT here, they said we weren't using more than 25% of it's ressources available so the bottleneck was definitely at the SQL level. So I asked for an update from SQL 2017 to 2022 last month and then, now that I saw that most of my heavy queries were always running serialized, started optimizing until I hit this one. I tried the OPTION(USE HINT('DISALLOW_BATCH_MODE'), MAXDOP 8); and I don't see any changes in speed.

tres) That request is indeed supposed to return about 14 million rows, so no worries on that side. But isn't the fact only 8 rows were estimated in the ressource reservation a reason why it's much slower than it should be?

more context) I was using a MSTVF before all my work this month, when I switched to an IVTF it is faster but the curve of time spent vs rows asked is exponential instead of linear if you get what I mean. I'm open to rethink how all this is done.

I work for a research group and a part of my job is extracting datasets for researchers. I'm pretty much the only heavy user on the database, my colleagues are more in the "inserting and cleaning the data" part of the job. So I can pretty much do what I want with the indexes, functions, etc. as long as the table structure itself is not changed too much.

Update 4 - What? I don't get it, I was trying to make a nice graphic to show the "time spent vs rows asked" exponential curve, so I changed my query to get nice square numbers.

select 
    count(*)
FROM
    (SELECT TOP 10000 * FROM individus.Individus WHERE AnneeNaissance > 1901 AND AnneeDeces < 1911) i CROSS APPLY
    individus.GetAscendanceSimple(i.IndID) a

And that ran in 10 seconds... Even tried TOP 10,000,000 and still fast, so I just have to put a arbitrary large number so all my cases are covered and it runs as fast as I would have hoped (The TOP is important). Before putting that as a solution, I must be wrong no? That's a really dumb fix if it's all we need to do to fix the planning.

Without subquery vs With subquery

0

2 Answers 2

3

The more I look at this, the more questions I have, in respect to the query plan. This probably won't answer your question on the first go-around, but let's get started.

uno

First, the plan XML indicates that you're on SQL Server 2022 RTM (16.0.1000.6), which puts you 11 cumulative updates behind current. I'm not blaming that on your problems, but it doesn't hurt to be up to date.

dos

Second, and most puzzling: are you on Standard or Enterprise edition of SQL Server, or does Individus a column store index on it somewhere?

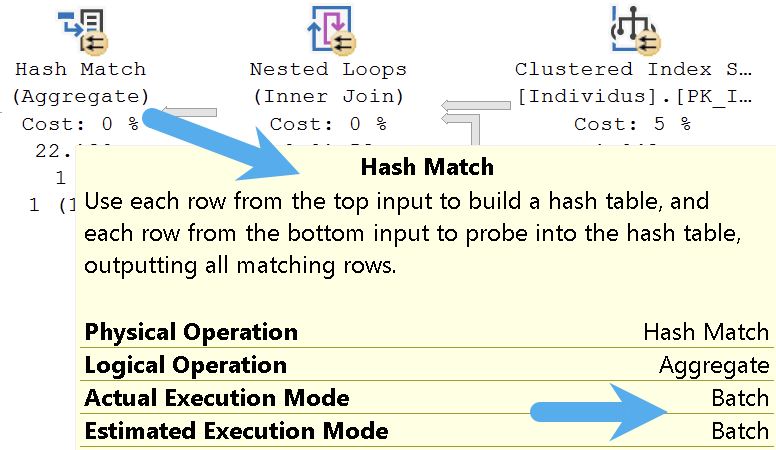
The reason I ask is because the optimizer decided that one operator in your plan should run in Batch Mode:

NUTS

Absent a column store index, that only happens in Enterprise Edition with the Intelligent Query Processing feature, Batch Mode On Row Store.

The thing that makes this all the more confusing is that your plan only runs with a Degree of Parallelism (DOP) of 2. Limiting Batch Mode operations to a DOP of 2 is something that only Standard Edition does.

Normally I'd chalk it up to you being on a really underpowered box, but the query plan also indicates that you have 12 threads available for a parallel query. Perhaps DOP is limited to two somewhere that the optimizer is unaware of.

EstimatedAvailableDegreeOfParallelism="12"

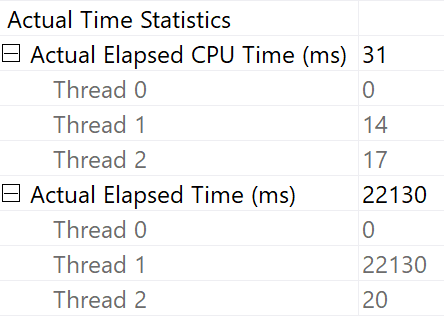
That becomes unfortunate in your case at the Hash Match Aggregate mentioned above, because one thread sits around for ~22 seconds waiting on HTBUILD.

<Wait WaitType="HTBUILD" WaitTimeMs="22113" WaitCount="2" />

Here are the Actual Time Statistics for the Hash Match Aggregate. Note the high duration (wall clock time) vs. very low CPU time.

NUTS

One thing you should try, is ending your query with OPTION(USE HINT('DISALLOW_BATCH_MODE'), MAXDOP 8);.

tres

All that aside, your query has some other pretty weird waits.

 <Wait WaitType="PAGELATCH_SH" WaitTimeMs="24798" WaitCount="7034617" />
 <Wait WaitType="PAGELATCH_EX" WaitTimeMs="23758" WaitCount="6969758" />
 

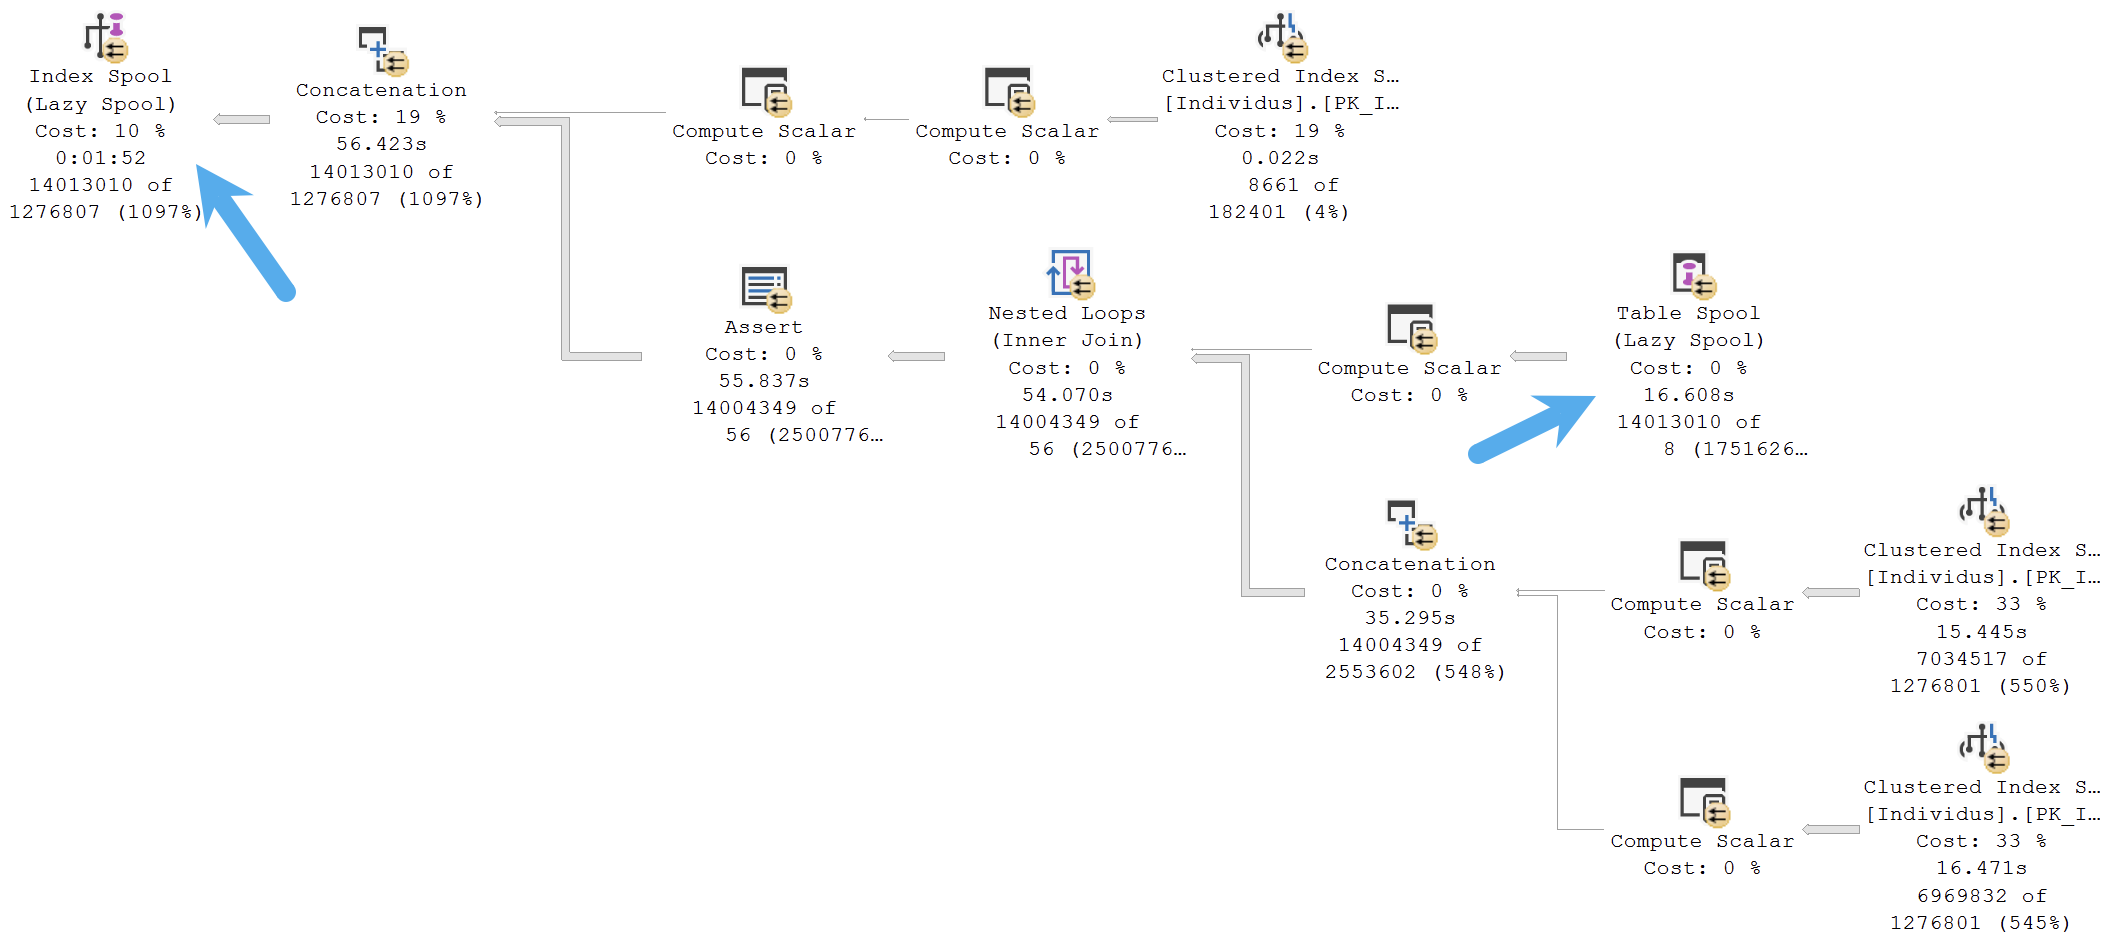
PAGELATCH_SH and PAGELATCH_EX combined account for ~49 seconds of wait time while your query executes. Here are most of the operator times in your plan prior to the Batch Mode Hash Match Aggregate:

NUTS

I stuck arrows pointing at two operators that use tempdb for storage, because sometimes (but not always, 'natch) those PAGELATCH_XX waits I was just talking about are associated with activity there. There's no way of getting around those spools in a recursive common table expression execution plan that I'm aware of.

Reading the operator times is a little quirky. In Row Mode, parent operators show not only their time, but time spent in child operators. In Batch Mode each operator only shows the time it spent.

One reason that I brought up potential tempdb contention here, is that your Lazy Index Spool gets fairly large, at ~14 million rows, and since loading that with data is the only thing that would generate PAGELATCH_EX waits, it's worth checking on.

okay, then

All that being said, cardinality estimation is not the root of your problem here, and using a MSTVF, which would use a table variable, would likely not help your tempdb situation, or your cardinality estimation situation.

While table variables in newer versions of SQL Server can get table-level cardinality estimates, they still don't get any column-level histograms built for them, even if you add an index. They will also cause a serial zone in your plan, whenever data is modified in them (in your case, on insert), and when the returned table variable is read from by the outer query.

Please edit your question to add any details of reading this. I'll try to keep up as time allows to edit my answer accordingly.

quatro

I don't have your database to experiment with, but I can make a reasonable go at things with my copy of the StackOverflow database.

To get things going, I added a couple indexes:

CREATE UNIQUE INDEX 
    HierarychyHelper 
ON dbo.Posts 
    (ParentId, Id, OwnerUserId) 
INCLUDE
    (Score) 
WITH 
    (SORT_IN_TEMPDB = ON, DATA_COMPRESSION = PAGE);

CREATE UNIQUE INDEX 
    HierarychyHelper 
ON dbo.Comments 
    (PostId, Id) 
INCLUDE
    (Score, UserId) 
WITH 
    (SORT_IN_TEMPDB = ON, DATA_COMPRESSION = PAGE);

And a function similar to yours:

CREATE OR ALTER FUNCTION
    dbo.HierarchyHelper
(
    @PostId integer
)
RETURNS table 
WITH SCHEMABINDING
AS
RETURN
(
    WITH 
        postparent AS 
    (
        SELECT 
            p.Id, 
            p.ParentId, 
            p.OwnerUserId,
            p.Score
        FROM dbo.Posts AS p WITH(FORCESEEK)
        WHERE p.Id = @PostId
      
        UNION ALL
      
        SELECT 
            p2.Id, 
            p2.ParentId, 
            p2.OwnerUserId,
            p2.Score
        FROM postparent pp
        JOIN dbo.Posts AS p2 WITH(FORCESEEK)
          ON pp.Id = p2.ParentId
      
        UNION ALL
      
        SELECT 
            c.Id, 
            c.PostId, 
            c.UserId,
            c.Score
        FROM postparent pp
        JOIN dbo.Comments AS c WITH(FORCESEEK)
          ON  pp.Id = c.PostId
    )
    SELECT
        pp.Id,
        pp.ParentId,
        pp.OwnerUserId,
        pp.Score
    FROM postparent AS pp
);
GO

And then a starting query that results in a Lazy Spool that gets about 14 million rows and change in it. I have some hints here to better match your environment.

SELECT
    c = COUNT_BIG(*)
FROM dbo.Posts AS p
CROSS APPLY dbo.HierarchyHelper(p.Id) AS hh
WHERE p.CreationDate >= '20130501'
OPTION
(
    USE HINT('QUERY_OPTIMIZER_COMPATIBILITY_LEVEL_160'), 
    MAXDOP 8
);

That query takes about 1 minute for me. Part of the problem is that recursive common table expressions don't generally qualify for parallel plans, and that parallel plans involving Nested Loops joins really just run DOP copies of the serial plan. Because of that, they're really sensitive to uneven row distributions on parallel threads.

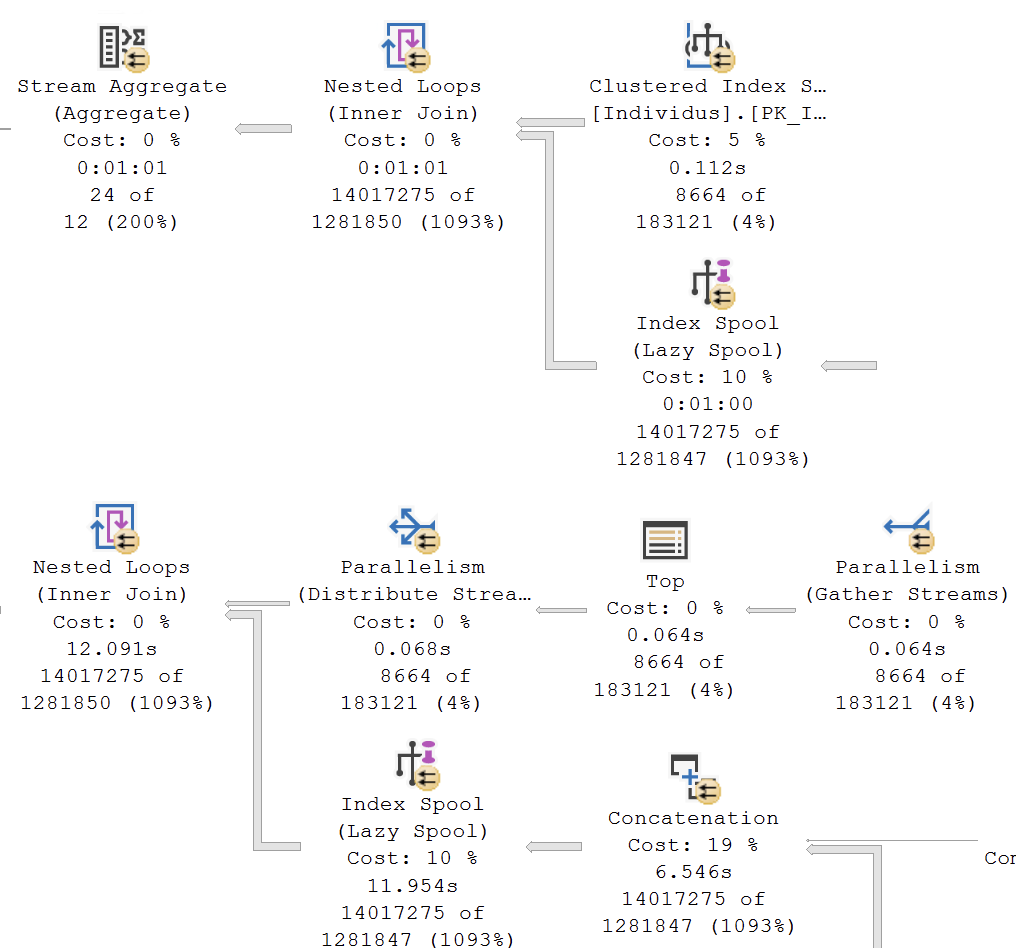
The reason why the query with a TOP in it runs so much faster is because the Top operator introduces a serial zone in the query plan, which requires a Distribute Streams Exchange operator to move the rows back into a parallel portion of the plan.

NUTS

I can duplicate the behavior by copying your queries:

SELECT
    c = COUNT_BIG(*)
FROM dbo.Posts AS p
CROSS APPLY dbo.HierarchyHelper(p.Id) AS hh
WHERE p.CreationDate >= '20130501'
OPTION
(
    USE HINT('QUERY_OPTIMIZER_COMPATIBILITY_LEVEL_160'), 
    MAXDOP 8
);


SELECT
    c = COUNT_BIG(*)
FROM 
(
    SELECT TOP (2147483647) 
        p.* 
    FROM dbo.Posts AS p 
    WHERE p.CreationDate >= '20130501'
) AS p
CROSS APPLY dbo.HierarchyHelper(p.Id) AS hh
OPTION
(
    USE HINT('QUERY_OPTIMIZER_COMPATIBILITY_LEVEL_160'), 
    MAXDOP 8
);

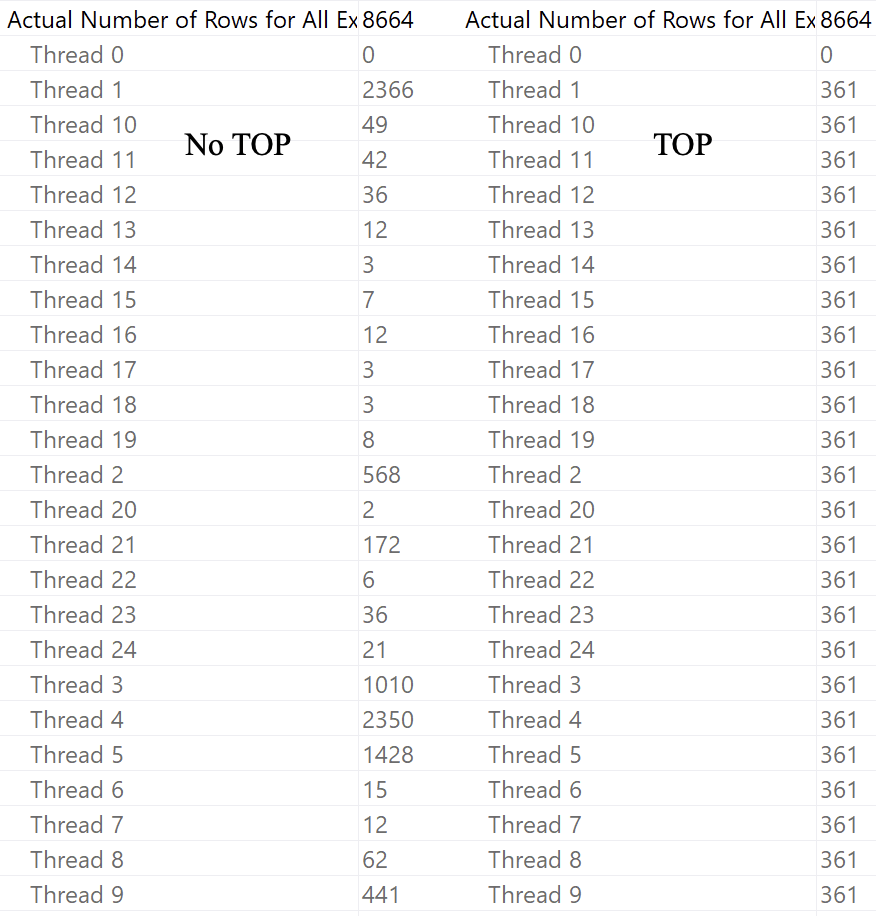
There is only about a 30 second difference in timing for me, but the reason why is both in your query plans and mine. Here are some screenshots of parallel row distribution in your two new example query plans:

NUTS

Of course, that issue wasn't obvious in the original query plan(s) you shared, because Batch Mode in Standard Edition was limiting you to a DOP of 2. In a fully row mode plan, where you can use a much higher DOP, the issue becomes clear.

You can learn a whole lot more about this in Adam Machanic's session on row goals.

2
  • So using TOP like this is a legitimate way to coerce SQL Server to take it's time to better split the job? Commented Jan 29 at 19:25
  • 1
    @JamesMcGrath yes, legitimate and reasonable. Perhaps not all that common, though. Commented Jan 29 at 19:43
-1

Since you've ruled everything aside from ITVFs, you're never going to get a good cardinality estimate from this. There is simply no way to know at compile time how many rows you're going to get. The ITVF restrictions rules out any useful tricks like OPTION (RECOMPILE) or temp tables. That said, I don't see any reason why you have ruled out multi-statement table-valued functions. Have you considered using table variables and OPTION (RECOMPILE)?

Frame challenge: Stop using recursive CTEs for this task. hierarchyid is the modern solution. Better yet, avoid SQL altogether if you can. This is a job for a graph database.

4
  • 3
    How would MSTVFs help? Table variables (at best) only get table cardinality for an estimate, with no statistical support like temp tables have. There’s also nothing at all in the presented query that HierarchyId would make better. Commented Jan 24 at 23:05
  • The problem with hierarchyid is that it can't support family tree type of data. I isolated the estimation error to the simplest query I could, but in reality there's a FatherID and MotherID. In fact, my real query has 14 columns. Commented Jan 25 at 13:53
  • And maybe I'm wrong, very possible, but don't MSTVFs block parallelism? The way I understand SQL Server : If a single element in a query is non-inlineable, the entire thing gets serialized. My recursive CTE is slow, but if it only uses one thread it's much MUCH worse... I mean like easily 10-20 times slower. Commented Jan 25 at 14:09
  • @JamesMcGrath MSTVFs got multiple improvements in 2019. I don't recall if parallelism is one of them, but it probably wasn't.
    – J. Mini
    Commented Jan 25 at 20:01

Your Answer

By clicking “Post Your Answer”, you agree to our terms of service and acknowledge you have read our privacy policy.

Not the answer you're looking for? Browse other questions tagged or ask your own question.