1

Our Google Cloud MySQL database had a huge and unexpected increase of used space in the span of a couple of days. It went from 15 GB to 16TB! This is also obviously causing issues with our billing as the cost for the SQL storage drastically increased.

After checking the storage via the Google Cloud SQL System Insights, we noticed that the increase is due to what Google SQL calls tmp_data. Here you can see how it skyrocketed:
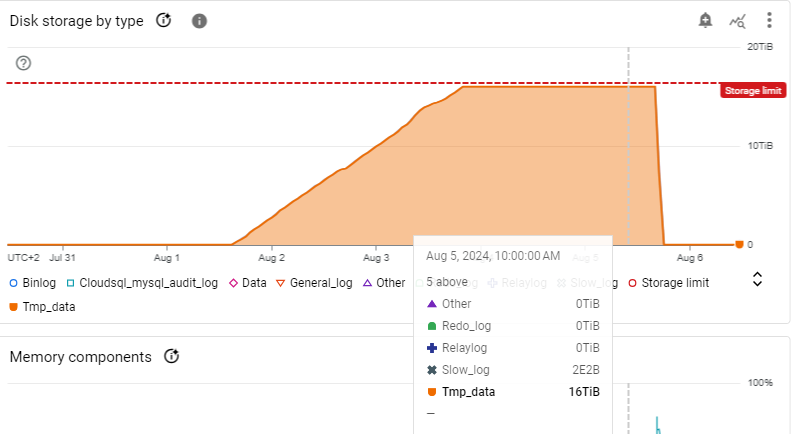
graph showing storage increase

Restarting the database instance cleared this tmp_data and restored the DB storage usage to the expected 15 GB it was before.

The SQL logs also don't seem to show anything significant other that error messages related to no available storage when the limit was hit.

I would like to understand what might be causing this issue. To start, I tried to look up what tmp_data is, but I cannot find a reliable answer to what this represents.

Questions:

  • What is tmp_data in Google Cloud MySQL?
  • What could I investigate to try to understand what the issue might be?
2
  • Have you tried contacting the vendor technical support? What did they say?
    – mustaccio
    Commented Aug 7 at 19:18
  • We did but so far the, still good, advice was to switch the internal_tmp_disk_storage_engine to MyISAM. This might help reducing the issue, however it is still happening. Commented Aug 12 at 8:51

1 Answer 1

0

With that amount of diskspace used, my gut feeling tells me to go check the history list for InnoDB

Next time tmp_data start climbing, please run this multiple times:

SELECT count FROM information_schema.innodb_metrics
WHERE name = 'trx_rseg_history_len';

If this number is high and increasing, this is a dead giveaway that MVCC info is piling up.

Then, please run this one:

SELECT a.trx_id,a.trx_state,a.trx_started
    ,a.trx_started TrxStarted
    ,FORMAT(UNIX_TIMESTAMP(NOW())-UNIX_TIMESTAMP(a.trx_started),0) TrxRunningTime
    ,a.trx_rows_modified,b.USER 
    ,b.host,b.db,b.command,b.time,b.state 
FROM information_schema.innodb_trx a,information_schema.processlist b 
WHERE a.trx_mysql_thread_id=b.id
ORDER BY a.trx_started DESC;

This will show you any transactions that have been stuck "Forever". Simply kill those transactions.

4
  • Thanks for your answer, I'll try to give a look at this next time this happens. I've also made more reasearch on this and it seems that setting internal_tmp_disk_storage_engine=MyISAM could have helped. However, the problem persist. Commented Aug 12 at 8:50
  • It happened again and indeed I noticed that: 1) the result from query 1 is increasing (7000+ and growing) 2) there are 8 transactions that have been running for 8 hours now I will try to kill those to see if it solves the issue. How can I understand what transactions are they? Commented Aug 13 at 6:43
  • Indeed killing those transactions restored the tmp_data. Further analyzing the state of the DB with show full processlist; gave us a better understanding of what were these queries, which helped us understanding where these queries where created from. Indeed, we can now reproduce this issue and are working on a fix that we are confident will solve the root issue. Many, many thanks @rolandomysqldba!! Commented Aug 13 at 9:50
  • If my answer helped you, please mark as accepted. Commented Aug 13 at 12:26

Your Answer

By clicking “Post Your Answer”, you agree to our terms of service and acknowledge you have read our privacy policy.

Not the answer you're looking for? Browse other questions tagged or ask your own question.