When I do dbcc show_statistics ('Reports_Documents', PK_Reports_Documents) I get the following result for Report ID 18698:

For this query:
SELECT *
FROM Reports_Documents
WHERE ReportID = 18698 option (recompile)
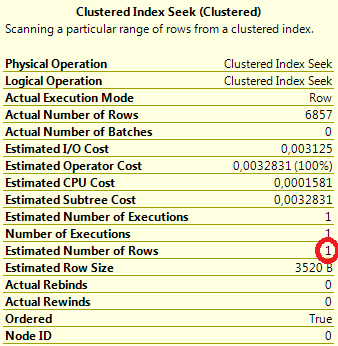
I get a query plan that makes a Clustered Index Seek on PK_Reports_Documents as expected.
But what baffles me is the incorrect value for Estimated Number of Rows:

According to this:
When the sample query WHERE clause value is equal to a histogram RANGE_HI_KEY value, SQL Server will use the EQ_ROWS column in the histogram to determine the number of rows that are equal to
This is also the way I would expect it to be, however it seems not to be the case in real life. I also tried some other RANGE_HI_KEY values that were present in the histogram provided by show_statistics and experienced the same. This issue in my case seems to cause some queries to use very unoptimal execution plans resulting in an execution time of a few minutes whereas I can get it to run in 1 sec with a query hint.
All in all: Can someone explain me why is EQ_ROWS from the histogram not being used for the Estimated Number of Rows and where does the incorrect estimate come from?
A bit more (possibly helpful) info:
- Auto create statistics is on and all the statistics are up to date.
- The table being queried has about 80 million rows.
PK_Reports_Documentsis a combination PK consisting ofReportID INTandDocumentID CHAR(8)
The query seems to load a total of 5 different statistics objects, all of which contain ReportID + some other columns from the table. They have all been freshly updated. RANGE_HI_KEY in the table below is the highest upper bound column value in the histogram.
+-------------------------------------------------------------------------+----------+--------------+--------------+---------------------+--------------+------------+----------+---------------------+----------------+
|                                  name                                   | stats_id | auto_created | user_created | Leading column Type | RANGE_HI_KEY | RANGE_ROWS | EQ_ROWS  | DISTINCT_RANGE_ROWS | AVG_RANGE_ROWS |
+-------------------------------------------------------------------------+----------+--------------+--------------+---------------------+--------------+------------+----------+---------------------+----------------+
| PK_Reports_Documents                                                    |        1 |            0 |            0 | Stationary          |        18722 | 0          | 2228,526 |                   0 | 1              |
| _dta_index_Reports_Documents_42_1629248859__K1_K63_K14_K13_K22_K23_72_6 |       62 |            0 |            0 | Stationary          |        18698 | 0          | 2228,526 |                   0 | 1              |
| _dta_stat_1629248859_1_1_59                                             |       76 |            0 |            1 | Stationary          |        18686 | 50,56393   | 1        |                   0 | 13397,04       |
| _dta_stat_1629248859_1_22_14_18_12_6                                    |       95 |            0 |            1 | Stationary          |        18698 | 0          | 2228,526 |                   0 | 1              |
| _dta_stat_1629248859_1_7_14_4_23_62                                     |       96 |            0 |            1 | Stationary          |        18698 | 56,63327   | 21641,5  |                   0 | 14526,44       |
+-------------------------------------------------------------------------+----------+--------------+--------------+---------------------+--------------+------------+----------+---------------------+----------------+
sp_updatestats is scheduled to run every night to update stats.
