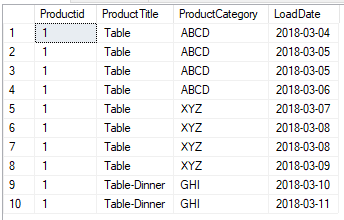
I am receiving transaction snapshot data from a file, it contains a history of repeated data. Currently trying to find Slowly Changing Dimensions on table with [ProductId] Business Key. Many attributes exist: ProductTitle, Category, this is a sample table, actually have around 10 more attributes. How do I create a Product Slowly Changing Dimension table query?
Searching for a performance optimized way, if I have 10 columns, not sure if Group By on 10 columns is optimal
With SQL 2016, is there a function to obtain this data? Should I use Lead/Lag Function? FirstValue/Last Value? New analytics syntax? An attempted query is below.
Note: Data comes from a 1970 legacy file system containing historical data.
Data:
create table dbo.Product
(
    ProductId int,
    ProductTitle varchar(55),
    ProductCategory varchar(255),
    Loaddate datetime
)

insert into dbo.Product
values
 (1,'Table','ABCD','3/4/2018')
,(1,'Table','ABCD','3/5/2018')
,(1,'Table','ABCD','3/5/2018')
,(1,'Table','ABCD','3/6/2018')
,(1,'Table','XYZ','3/7/2018')
,(1,'Table','XYZ','3/8/2018')
,(1,'Table','XYZ','3/8/2018')
,(1,'Table','XYZ','3/9/2018')
,(1,'Table-Dinner', 'GHI','3/10/2018')
,(1,'Table-Dinner', 'GHI','3/11/2018')
....more data with ProductId =2,3,4, etc
Current Repeated Data in File:
Expected Output:
Attempted Query
(seems to be inefficient, especially when having 10 attribute columns)
select
    product.Productid
    ,product.ProductTitle
    ,product.ProductCategory
    ,min(product.LoadDate) as BeginDate
    ,case when max(product.LoadDate)  = (select max(subproduct.LoadDate) from dbo.Product subproduct where subproduct.productid = product.productid) then '12/31/9999' else max(product.loadDate) end as EndDate
from dbo.Product product
group by Productid, ProductTitle, ProductCategory


