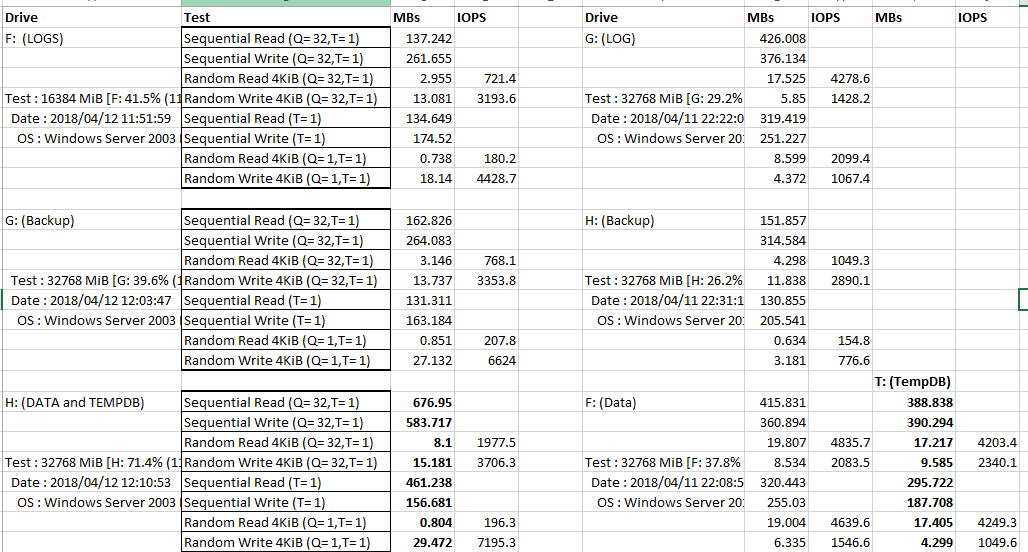
I noticed that the estimate and actual rows was way out and updated the stats on all tables in the view. Funny enough I have noticed now the latency has dropped down since doing this. I have ran Crystal Disk Mark on the old physical (Left) and this new virtual server (right).

There seems to be a significant difference in the Sequential Read/Writes and differences in the Random Read/Writes between the H:\H:\ Drive on the old PhsicalPhysical and the T:\T:\ Drive on the new virtual. The Random Reads seem to be performing better on the new server but the writes are slower. I’ve highlighted these drives as this is where the TempDB is situated on both servers.
I'm in a fight with the SAN guys at the moment, as they are saying everything is fine at their end, even though I've graphed the perfmon files and can show that disk latency wen'twent through the roof last week on a specific day and not sure if it's coincidence or not but the jobs that are not completing started to fail after this spike in the SAN. Disk Latency is averaging now about 80-100 ms, so way over the 20ms acceptable level.
I've uploaded the plan to paste the plan https://www.brentozar.com/pastetheplan/?id=ryUlA0pjzuploaded the plan (just the view).
Does anyone have any tips on how to tune this query please? It makes me feel faint just looking at this and knowing it's probably in other stored procs across the estate :(. It's selecting 100 million rows to bring back 10.
It's selecting 100 million rowsI have updated the stats and this seems to bring back 10 :(have dropped the latency on the disks, though we also enabled Optimize for Ad hoc workloads.
The view###View definition: