0

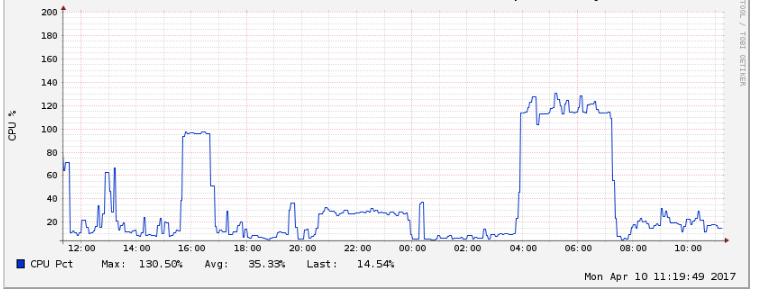
My server is showing high cpu usage between 10 am and 2 pm (IST) since last few days. The traffic is prretty much constant throughout the day with no significant jump or fall at any of these time. Even the background tasks are not running at that time. Analyzing the access logs, there is nothing specific about these time. Yet the cpu usage remains near 140% for 3-4 hours continuously.

We are using ubuntu 14.04, mysql 5.7, apache2, django1.10

Using top, I figured out the most of the CPU (around 90% +) is being used by Mysql continuously and the RAM usage is also too high.

Can anyone suggest me what to look for and how to reach a solution or even find the culprit.

cpu usage

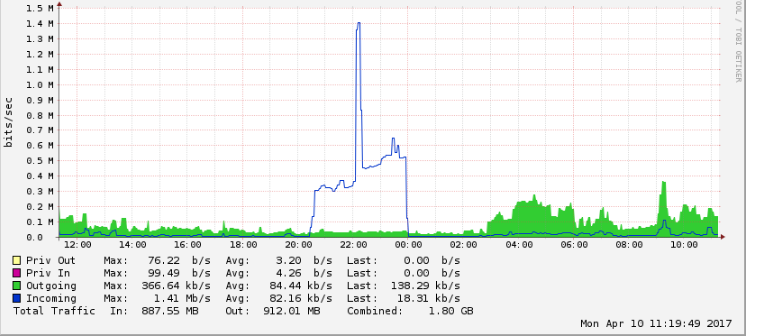
network

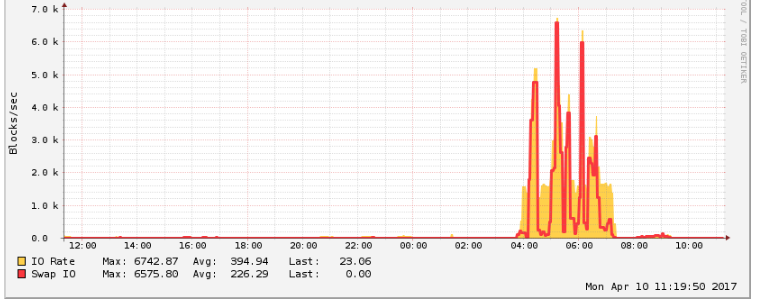
swap io

Including the content of my.cnf

[client]
port            = 3306
socket          = /var/run/mysqld/mysqld.sock

[mysqld_safe]
pid-file        = /var/run/mysqld/mysqld.pid
socket          = /var/run/mysqld/mysqld.sock
nice            = 0

[mysqld]
user            = mysql
pid-file        = /var/run/mysqld/mysqld.pid
socket          = /var/run/mysqld/mysqld.sock
port            = 3306
basedir         = /usr
datadir         = /var/lib/mysql
tmpdir          = /tmp
lc-messages-dir = /usr/share/mysql
explicit_defaults_for_timestamp

# Instead of skip-networking the default is now to listen only on
# localhost which is more compatible and is not less secure.
bind-address    = 0.0.0.0

log-error       = /var/log/mysql/error.log

# Disabling symbolic-links is recommended to prevent assorted security risks
symbolic-links=0

# * IMPORTANT: Additional settings that can override those from this file!
#   The files must end with '.cnf', otherwise they'll be ignored.
#
!includedir /etc/mysql/conf.d/

Also, conf.d/ is empty. Seems that they have removed most of the default options from my.cnf

RAM: 2GB. Earlier in django settings there was CONN_MAX_AGE = 100 but i have removed it as i read that almost always persistent connection serve no good now and will try to see the effect tomorrow afternoon.

2 Answers 2

1

100% CPU very often means one particular query is running. And it needs a better index. Or a better formulation.

Turn on the slowlog, with long_query_time = 1. If you can get to the file, then use mysqldumpslow -s t or pt-query-digest to find the worst coupld of queries. Then we can discuss what 'composite' index to add (or whatever).

Swapping is terrible for MySQL. Lower some settings to avoid it. Let's see my.cnf and RAM size to help advise.

5
  • Have turned on slow query log and will wait until tomorrow afternoon to find out if that is causing any issue. RAM size is 2GB. I have been doing with the default settings for mysql5.7.
    – sprksh
    Commented Apr 10, 2017 at 19:02
  • If you are using InnoDB, then innodb_buffer_pool_size should be no more than, say, 500M for your tiny 2GB server.
    – Rick James
    Commented Apr 11, 2017 at 5:14
  • Yes, I am using InnoDB. Earlier it was 128 MB. After doing some research yesterday, I found that it should be 75-80% of RAM. So i made it 1600MB and I got much better results today. The database size is more than 2GB.
    – sprksh
    Commented Apr 11, 2017 at 11:05
  • Danger! 1600MB is too big for a 2GB server. Back off to 500M. The 75-80% recommendation is intended for bigger than 4GB of RAM.
    – Rick James
    Commented Apr 11, 2017 at 17:36
  • Will be testing the various configurations but found out the actual culprit for high CPU usage were slow queries only as you suggested initially. Will be optimizing the queries.
    – sprksh
    Commented Apr 12, 2017 at 12:23
0

Please check the MySQL General Log if it is enabled to understand what is running during this time in MySQL.

Your Answer

By clicking “Post Your Answer”, you agree to our terms of service and acknowledge you have read our privacy policy.

Not the answer you're looking for? Browse other questions tagged or ask your own question.