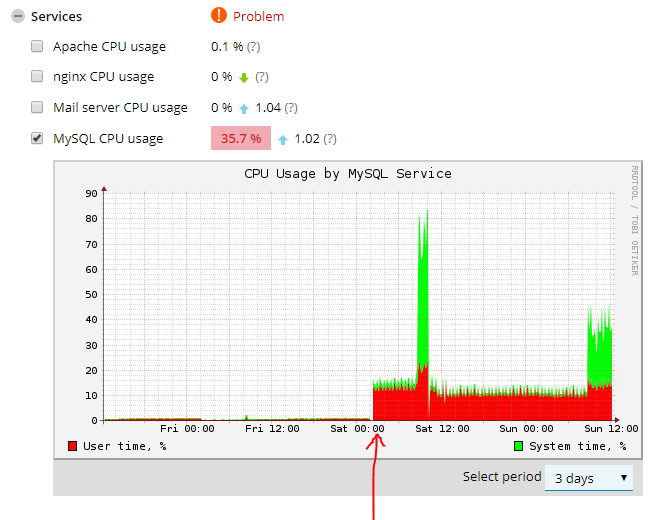
I've had a big crash on my server 2 days ago, still don't know why, but after resurrect it the mysql server is consuming a huge amount of cpu and I don't know why:
The server is Mariadb installed by plesk, the my.cnf is completly empty, there is no config at all, everything default like before the crash.
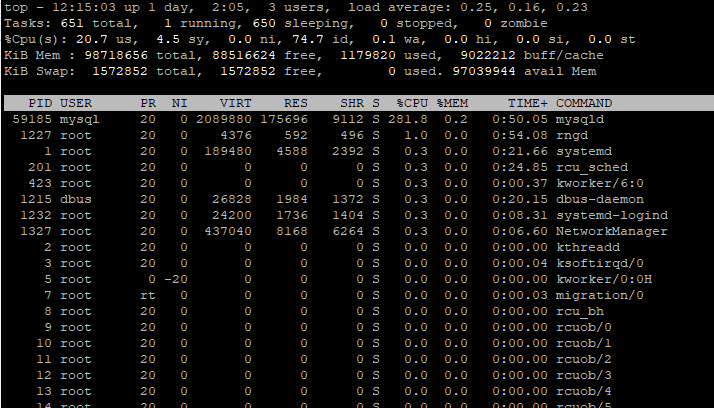
There are no queries in the processlist, but the mysqld process is getting peaks of 200-300% cpu usage:
Here is what mysqltuner says:
 >>  MySQLTuner 1.7.10 - Major Hayden
 >>  Bug reports, feature requests, and downloads at http://mysqltuner.com/
 >>  Run with '--help' for additional options and output filtering

[--] Skipped version check for MySQLTuner script
[OK] Logged in using credentials passed on the command line
[OK] Currently running supported MySQL version 5.5.60-MariaDB
[OK] Operating on 64-bit architecture

-------- Log file Recommendations ------------------------------------------------------------------
[--] Log file: /var/log/mariadb/mariadb.log(23K)
[OK] Log file /var/log/mariadb/mariadb.log exists
[OK] Log file /var/log/mariadb/mariadb.log is readable.
[OK] Log file /var/log/mariadb/mariadb.log is not empty
[OK] Log file /var/log/mariadb/mariadb.log is smaller than 32 Mb
[!!] /var/log/mariadb/mariadb.log contains 13 warning(s).
[!!] /var/log/mariadb/mariadb.log contains 17 error(s).
[--] 14 start(s) detected in /var/log/mariadb/mariadb.log
[--] 1) 180826 12:06:05 [Note] /usr/libexec/mysqld: ready for connections.
[--] 2) 180825 12:35:37 [Note] /usr/libexec/mysqld: ready for connections.
[--] 3) 180825 12:26:25 [Note] /usr/libexec/mysqld: ready for connections.
[--] 4) 180825 12:23:35 [Note] /usr/libexec/mysqld: ready for connections.
[--] 5) 180825 10:09:44 [Note] /usr/libexec/mysqld: ready for connections.
[--] 6) 180825 10:00:49 [Note] /usr/libexec/mysqld: ready for connections.
[--] 7) 180825  2:08:32 [Note] /usr/libexec/mysqld: ready for connections.
[--] 8) 180822  3:19:35 [Note] /usr/libexec/mysqld: ready for connections.
[--] 9) 170919  3:37:31 [Note] /usr/libexec/mysqld: ready for connections.
[--] 10) 161219  3:28:50 [Note] /usr/libexec/mysqld: ready for connections.
[--] 10 shutdown(s) detected in /var/log/mariadb/mariadb.log
[--] 1) 180826 12:06:03 [Note] /usr/libexec/mysqld: Shutdown complete
[--] 2) 180825 12:35:36 [Note] /usr/libexec/mysqld: Shutdown complete
[--] 3) 180825 12:26:24 [Note] /usr/libexec/mysqld: Shutdown complete
[--] 4) 180825 12:23:33 [Note] /usr/libexec/mysqld: Shutdown complete
[--] 5) 180822  3:19:33 [Note] /usr/libexec/mysqld: Shutdown complete
[--] 6) 170919  3:37:30 [Note] /usr/libexec/mysqld: Shutdown complete
[--] 7) 161219  3:28:49 [Note] /usr/libexec/mysqld: Shutdown complete
[--] 8) 161107 12:00:22 [Note] /usr/libexec/mysqld: Shutdown complete
[--] 9) 161107 10:45:08 [Note] /usr/libexec/mysqld: Shutdown complete
[--] 10) 161104 22:21:22 [Note] /usr/libexec/mysqld: Shutdown complete

-------- Storage Engine Statistics -----------------------------------------------------------------
[--] Status: +ARCHIVE +Aria +BLACKHOLE +CSV +FEDERATED +InnoDB +MEMORY +MRG_MYISAM +MyISAM +PERFORMANCE_SCHEMA
[--] Data in MyISAM tables: 1.7G (Tables: 27)
[--] Data in InnoDB tables: 51.3M (Tables: 379)
[OK] Total fragmented tables: 0

-------- Security Recommendations ------------------------------------------------------------------
[OK] There are no anonymous accounts for any database users
[OK] All database users have passwords assigned
[!!] There is no basic password file list!

-------- CVE Security Recommendations --------------------------------------------------------------
[--] Skipped due to --cvefile option undefined

-------- Performance Metrics -----------------------------------------------------------------------
[--] Up for: 12m 16s (1K q [1.935 qps], 118 conn, TX: 1M, RX: 383K)
[--] Reads / Writes: 88% / 12%
[--] Binary logging is disabled
[--] Physical Memory     : 94.1G
[--] Max MySQL memory    : 1.2G
[--] Other process memory: 397.8M
[--] Total buffers: 800.0M global + 2.8M per thread (151 max threads)
[--] P_S Max memory usage: 0B
[--] Galera GCache Max memory usage: 0B
[OK] Maximum reached memory usage: 833.4M (0.86% of installed RAM)
[OK] Maximum possible memory usage: 1.2G (1.27% of installed RAM)
[OK] Overall possible memory usage with other process is compatible with memory available
[OK] Slow queries: 0% (0/1K)
[OK] Highest usage of available connections: 7% (12/151)
[OK] Aborted connections: 0.85%  (1/118)
[!!] name resolution is active : a reverse name resolution is made for each new connection and can reduce performance
[!!] Query cache may be disabled by default due to mutex contention.
[!!] Query cache efficiency: 0.0% (0 cached / 984 selects)
[OK] Query cache prunes per day: 0
[OK] Sorts requiring temporary tables: 0% (0 temp sorts / 619 sorts)
[!!] Joins performed without indexes: 5
[OK] Temporary tables created on disk: 4% (87 on disk / 1K total)
[!!] Thread cache is disabled
[!!] Table cache hit rate: 18% (400 open / 2K opened)
[OK] Open file limit used: 8% (91/1K)
[OK] Table locks acquired immediately: 99% (2K immediate / 2K locks)

-------- Performance schema ------------------------------------------------------------------------
[--] Performance schema is disabled.
[--] Memory used by P_S: 0B
[--] Sys schema isn't installed.

-------- ThreadPool Metrics ------------------------------------------------------------------------
[--] ThreadPool stat is enabled.
[--] Thread Pool Size: 12 thread(s).
[--] Using default value is good enough for your version (5.5.60-MariaDB)

-------- MyISAM Metrics ----------------------------------------------------------------------------
[!!] Key buffer used: 18.2% (97M used / 536M cache)
[OK] Key buffer size / total MyISAM indexes: 512.0M/119.0M
[OK] Read Key buffer hit rate: 98.6% (7K cached / 101 reads)
[!!] Write Key buffer hit rate: 85.8% (394 cached / 338 writes)

-------- InnoDB Metrics ----------------------------------------------------------------------------
[--] InnoDB is enabled.
[--] InnoDB Thread Concurrency: 0
[!!] InnoDB File per table is not activated
[OK] InnoDB buffer pool / data size: 128.0M/51.3M
[!!] Ratio InnoDB log file size / InnoDB Buffer pool size (7.8125 %): 5.0M * 2/128.0M should be equal 25%
[OK] InnoDB buffer pool instances: 1
[--] InnoDB Buffer Pool Chunk Size not used or defined in your version
[OK] InnoDB Read buffer efficiency: 98.54% (95807 hits/ 97227 total)
[!!] InnoDB Write Log efficiency: 74.14% (129 hits/ 174 total)
[OK] InnoDB log waits: 0.00% (0 waits / 45 writes)

-------- AriaDB Metrics ----------------------------------------------------------------------------
[--] AriaDB is enabled.
[OK] Aria pagecache size / total Aria indexes: 128.0M/1B

-------- TokuDB Metrics ----------------------------------------------------------------------------
[--] TokuDB is disabled.

-------- XtraDB Metrics ----------------------------------------------------------------------------
[--] XtraDB is disabled.

-------- RocksDB Metrics ---------------------------------------------------------------------------
[--] RocksDB is disabled.

-------- Spider Metrics ----------------------------------------------------------------------------
[--] Spider is disabled.

-------- Connect Metrics ---------------------------------------------------------------------------
[--] Connect is disabled.

-------- Galera Metrics ----------------------------------------------------------------------------
[--] Galera is disabled.

-------- Replication Metrics -----------------------------------------------------------------------
[--] Galera Synchronous replication: NO
[--] No replication slave(s) for this server.
[--] Binlog format: STATEMENT
[--] XA support enabled: ON
[--] Semi synchronous replication Master: Not Activated
[--] Semi synchronous replication Slave: Not Activated
[--] This is a standalone server

-------- Recommendations ---------------------------------------------------------------------------
General recommendations:
    Control warning line(s) into /var/log/mariadb/mariadb.log file
    Control error line(s) into /var/log/mariadb/mariadb.log file
    MySQL was started within the last 24 hours - recommendations may be inaccurate
    Configure your accounts with ip or subnets only, then update your configuration with skip-name-resolve=1
    Adjust your join queries to always utilize indexes
    Set thread_cache_size to 4 as a starting value
    Increase table_open_cache gradually to avoid file descriptor limits
    Read this before increasing table_open_cache over 64: http://bi t.ly/1mi7c4C
    This is MyISAM only table_cache scalability problem, InnoDB not affected.
    See more details here: https://bugs.mysql.com/bug.php?id=49177
    This bug already fixed in MySQL 5.7.9 and newer MySQL versions.
    Beware that open_files_limit (1024) variable
    should be greater than table_open_cache (400)
    Consider installing Sys schema from https://git hub.com/mysql/mysql-sys
    Before changing innodb_log_file_size and/or innodb_log_files_in_group read this: http://bi t.ly/2wgkDvS
Variables to adjust:
    query_cache_size (=0)
    query_cache_type (=0)
    query_cache_limit (> 1M, or use smaller result sets)
    join_buffer_size (> 128.0K, or always use indexes with JOINs)
    thread_cache_size (start at 4)
    table_open_cache (> 400)
    innodb_file_per_table=ON
    innodb_log_file_size should be (=16M) if possible, so InnoDB total log files size equals to 25% of buffer pool size.
Could you help me? i'm desperate, thanks!
EDIT:
- I've deleted all databases and reimported the dump, same problem.
- I've upgraded mariadb, same problem.
- I've deleted the /var/lib/mysql folder, reinstalled mariadb and imported the dump again, same problem.
Any idea? the only thing I can do is format and reinstall the whole server but I would like to know how repair this kind of problems...


mysqldumpthem and then drop and recreate from dumps.