2

I'm having some delays when insert into a table. The funny thing is that it doesn't always happen.

Basically it's part of a load test that I created to compare some new features. I run the store procedure for a bunch of lists and there are some lists that always get delayed taking 3 hours to end and other that always are executed in a acceptable time (10 minutes).

At this point, look at performance monitor and the disk is reading at 1mb/s, so there isn't any of high load on the disk.

Also using extended events, look at "waits", saw the main wait is PAGEIOLATCH_EX, but as I said, the disk is reading at low rate, so what happen here?

CREATE TABLE SubscriberByList (
    SubscriberId INT NOT NULL
    ,ListId INT NOT NULL
    ,AddedAt DATETIME NOT NULL DEFAULT GETUTCDATE()
    ,Active BIT DEFAULT 1
    ,CONSTRAINT [PK_SubscriberByList] PRIMARY KEY CLUSTERED (ListId, SubscriberId)
    );

This table has 2.381.451.668 rows. A non clustered index on SubscriberId. SubscriberId and ListId are FK. Also a indexed view to count the amount of subscribers by each list.

On my test environment I created a procedure as following.

CREATE PROCEDURE [dbo].[LoadTest] @ListId INT 
AS
BEGIN
    CREATE TABLE #Subscribers (SubscriberId INT, Active BIT, HashKey as convert(binary(32),HASHBYTES('SHA2_256',convert(varchar,SubscriberId))) PERSISTED,PRIMARY KEY CLUSTERED(HashKey))


    INSERT INTO #Subscribers (SubscriberId, Active)
    SELECT SubscriberId, Active
    FROM dbo.SubscriberByList sxl
    where sxl.ListId = @ListId


    DELETE TOP (1000) dbo.SubscriberByList
    WHERE ListId = @ListId

    WHILE @@ROWCOUNT = 1000
    BEGIN
        DELETE TOP (1000) dbo.SubscriberByList
        WHERE ListId = @ListId
    END

    DECLARE @Offset INT = 0
        ,@Amount INT = 1000
    INSERT INTO dbo.SubscriberByList (SubscriberId, ListId, Active)
    SELECT SubscriberId, @ListId,Active
    FROM (SELECT SubscriberId, Active
        FROM #Subscribers
        ORDER BY HashKey
        OFFSET @Offset ROWS
        FETCH NEXT @Amount ROWS ONLY
        ) x

    WHILE @@ROWCOUNT = @Amount
    BEGIN
        SET @Offset = @Offset + @Amount

        INSERT INTO dbo.SubscriberByList (SubscriberId, ListId, Active)
        SELECT SubscriberId, @ListId,Active
        FROM (SELECT SubscriberId, Active
            FROM #Subscribers
            ORDER BY HashKey
            OFFSET @Offset ROWS
            FETCH NEXT @Amount ROWS ONLY
            ) x
    END

    DROP TABLE #Subscribers
END

The delay is on INSERT INTO dbo.SubscriberByList.

The HashKey is to get the subscribers distributed. As a new test I remove the HashKey and use as PK the SubscriberId. With this change the performance is improved but this isn't as real as distributed insertion and also isn't as expected because it takes 1 hour to complete.

What could happen since one list take 10 minutes to process 2.7 millions of rows and the other with similar amount takes 3 hours (1 hour on the best case)?

Thanks!

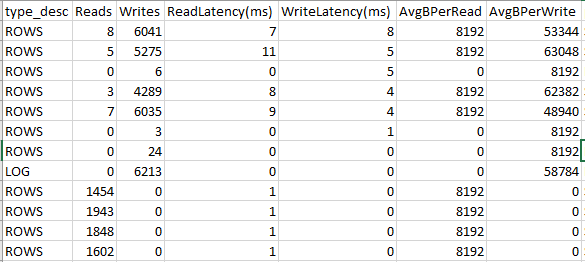
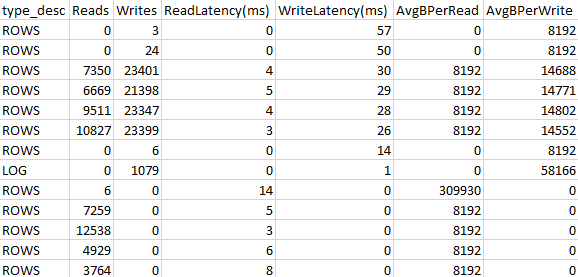
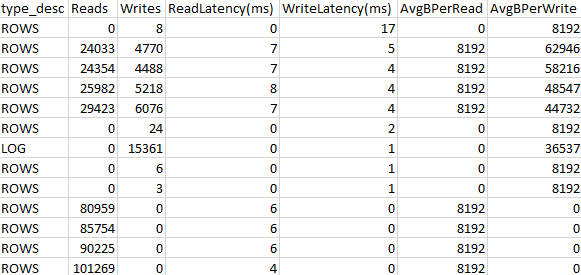
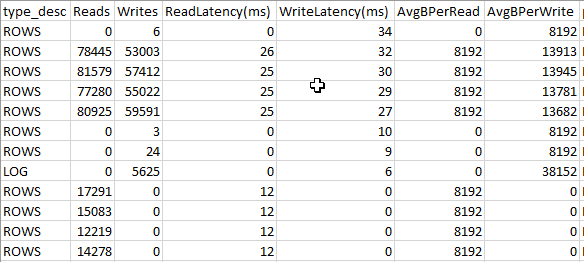
EDIT 1: Thanks for your comments, now I realize that delay also happen on the delete! here are some stats using the suggested Paul Randal script, taking 3 minutes on each test

Fast Insert:

Fast Insert

Slow Insert:

Slow Insert

Fast Delete:

Fast Delete

Slow Delete:

Slow Delete

So, on slow operations there are more number of reads/writes, but a small number of bytes. Right?

Also the delete is on the primary key, why take more time for the same amount of subscribers?

Why is that?

9
  • Bring up perfmon and look at the metric disk write/sec and disk read\sec under the disks youre using for data and logs while you are experiencing this slow down. What's the number? This might not be a throughput issue, it might be a bandwidth issue. Commented Jul 31, 2019 at 21:16
  • What's the resource your query is waiting on when the PAGEIOLATCH_EX occurs? Also, check your log file throughput using sys.dm_io_virtual_file_stats (check here for an existing script).
    – GMassDBA
    Commented Aug 1, 2019 at 9:52
  • Why are you deleting data just to re-insert it (or am I just reading your code incorrectly)? I would hope an UPDATE statement would be a much more efficient statement to run in this scenario. Commented Aug 1, 2019 at 14:41
  • It's part of a test, I will add some triggers and I need to compare current version vs new version. So I created this SP to run multiple times in parallel and see how the new structure behave
    – Mariano G
    Commented Aug 1, 2019 at 14:46
  • Your write latency actually doesn't look terrible. That's how long it takes the disk when SQL Server requests 1 page (8k) to respond. It's acceptable at a minimum. GabSQL had a good idea, can you see what its waiting on? Commented Aug 1, 2019 at 15:16

1 Answer 1

1

Thanks GabSQL, I found on wait_complete the resource information, after running the test and capture the data, executed the following script to summarize how many times the pageiolatch_EX has to wait by each index.

;WITH cte
AS (
    SELECT ed = CONVERT(XML, target_data)
    FROM sys.dm_xe_session_targets xet
    INNER JOIN sys.dm_xe_sessions xe ON xe.[address] = xet.event_session_address
    WHERE xe.name = N'Track_wait_stat'
        AND xet.target_name = N'ring_buffer'
    )
SELECT resource_description = x.ed.query('.').value(N'(event/data[@name="wait_resource"]/value)[1]', N'varchar(20)')
INTO #t
FROM cte
CROSS APPLY cte.ed.nodes(N'RingBufferTarget/event') AS x(ed);

SELECT obj.name, obj.index_id, count(1) as Occurrences
FROM (
    SELECT Page_Id = right(t.resource_description, charindex(':', reverse(t.resource_description) + ':') - 1)
        ,databaseId = LEFT(t.resource_description, charindex(':', t.resource_description)-1)
        ,FileId = Substring(t.resource_description, charindex(':', t.resource_description) + 1, charindex(':', t.resource_description, charindex(':', t.resource_description) + 1) - charindex(':', t.resource_description) - 1)
    FROM #t t
    ) x
JOIN sys.dm_os_buffer_descriptors AS bd ON x.databaseId = bd.database_id AND bd.page_id = x.Page_Id
INNER JOIN (
    SELECT object_name(object_id) AS name
        ,index_id
        ,allocation_unit_id
    FROM sys.allocation_units AS au
    INNER JOIN sys.partitions AS p ON au.container_id = p.hobt_id
        AND (
            au.type = 1
            OR au.type = 3
            )

    UNION ALL

    SELECT object_name(object_id) AS name
        ,index_id
        ,allocation_unit_id
    FROM sys.allocation_units AS au
    INNER JOIN sys.partitions AS p ON au.container_id = p.partition_id
        AND au.type = 2
    ) AS obj ON bd.allocation_unit_id = obj.allocation_unit_id
GROUP by obj.name, obj.index_id
drop table #t

This info tels me the index who is waiting is the nonclustered with SubscriberId as key. This lead to look at fragmentation and it was of 47%, I was suprised because I have a job who do the maintenance, but for some tricky condition and a server migration few months ago, this index (and others too) where left behinde.

I rebuilded to get the fragmentation to 0 and restart the engine to flush out the cache (is a testing enviroment). After test it again a few times, the performance was improve, but still there is a delay (10 min vs 30 min) and the waits are on the same index.

Something I noticed is that for the list that runs fast, it uses much less RAM (half), and since this a test enviroment, for the slow one it reach the maximum, so this could be the reason why it take a little more of to finish.

I think I could work with this delays now.

Thanks all.

Your Answer

By clicking “Post Your Answer”, you agree to our terms of service and acknowledge you have read our privacy policy.

Not the answer you're looking for? Browse other questions tagged or ask your own question.