0

I'm running MSSQL Server 2019 standard edition and it has 48GB of physical memory and 44GB of SQL Server's max memory.

There is nothing on the host but SqlServer.

All of request from application servers are just calling stored procedures and there are thousands of procedures.

The problem is that DB CPU usage hits 80% above very often.

Whenever DB CPU reaches 50% above, stored Procedure recompiling is soaring up and dm_exec_cached_plans view table is refreshed every time I scan it.

SELECT sum(CAST (size_in_bytes as decimal (14,2))) / 1048576 AS [Cache plan size MB] 
  FROM sys.dm_exec_cached_plans

enter image description here

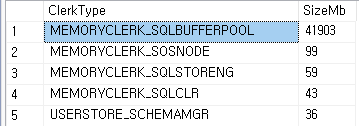
And sys.dm_os_memory_clerks are showing like below...

enter image description here

Is this small cache plan size normal?

If this is not, how can I handle this situation?

Any advice would be appreciated.

10
  • I appreciate your advice, I'll check it. Do you mean that data buffer cache has the first priority and it pulls out plan cache when it need?
    – KIM
    Commented Sep 7, 2023 at 7:57
  • No, I mean high CPU is very often a symptom of large table scans in turn caused by not having the right indexes Commented Sep 7, 2023 at 7:58
  • 1
    From the info in the question it sounds like the high CPU usage is being caused by the high number of recompiles and so I think you are on the right track with investigating why this happening. And the cache size does seem much lower than typical. Do you have anything regularly scheduled that would flush the plan cache? What does sys.dm_os_memory_clerks show? Commented Sep 7, 2023 at 8:53
  • 1
    Aside... your max server memory setting seems way too high. Accepted practice is to start with about 75% of a system's available memory (assuming there's only a single SQL Server instance on the machine). The setting only limits the size of the SQL Server buffer pool and more memory will be required for other allocations such as backup buffers, extended stored procedures, sp_OA methods (you aren't using those, right?), linked server connections, etc.. Commented Sep 7, 2023 at 9:07
  • 1
    @alwaysLearning the general rule of thumb is 10% or 4GB (depends what else is on the server), leaving 25% is too high IMO Commented Sep 7, 2023 at 9:08

1 Answer 1

1

I'm answering my question for my self based on how I've got through this situation.

First of all, the root cause was recompiling of stored procedure due to memory pressure.

Whenever CPU hits high, dm_os_memory_clerks showed me that MEMORYCLERK_SQLBUFFERPOOL usage was almost 100% of total memory assigned to SQLServer instance and CACHESTORE_SQLCP/CACHESTORE_OBJCP dropped to zero. Furthermore, I could see so many recompile events from the extened event session.

Once I doubled memory, recompile event rarely happened and CPU started cooling-down. MEMORYCLERK_SQLBUFFERPOOL usage keeps 85% of SQLServer memory and it keeps stabilized so far.

I hope this post can help some one else out there.

@Martin Smith, Thanks.

Your Answer

By clicking “Post Your Answer”, you agree to our terms of service and acknowledge you have read our privacy policy.

Not the answer you're looking for? Browse other questions tagged or ask your own question.