4

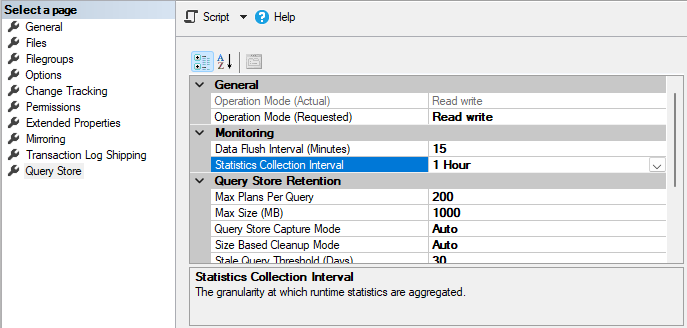
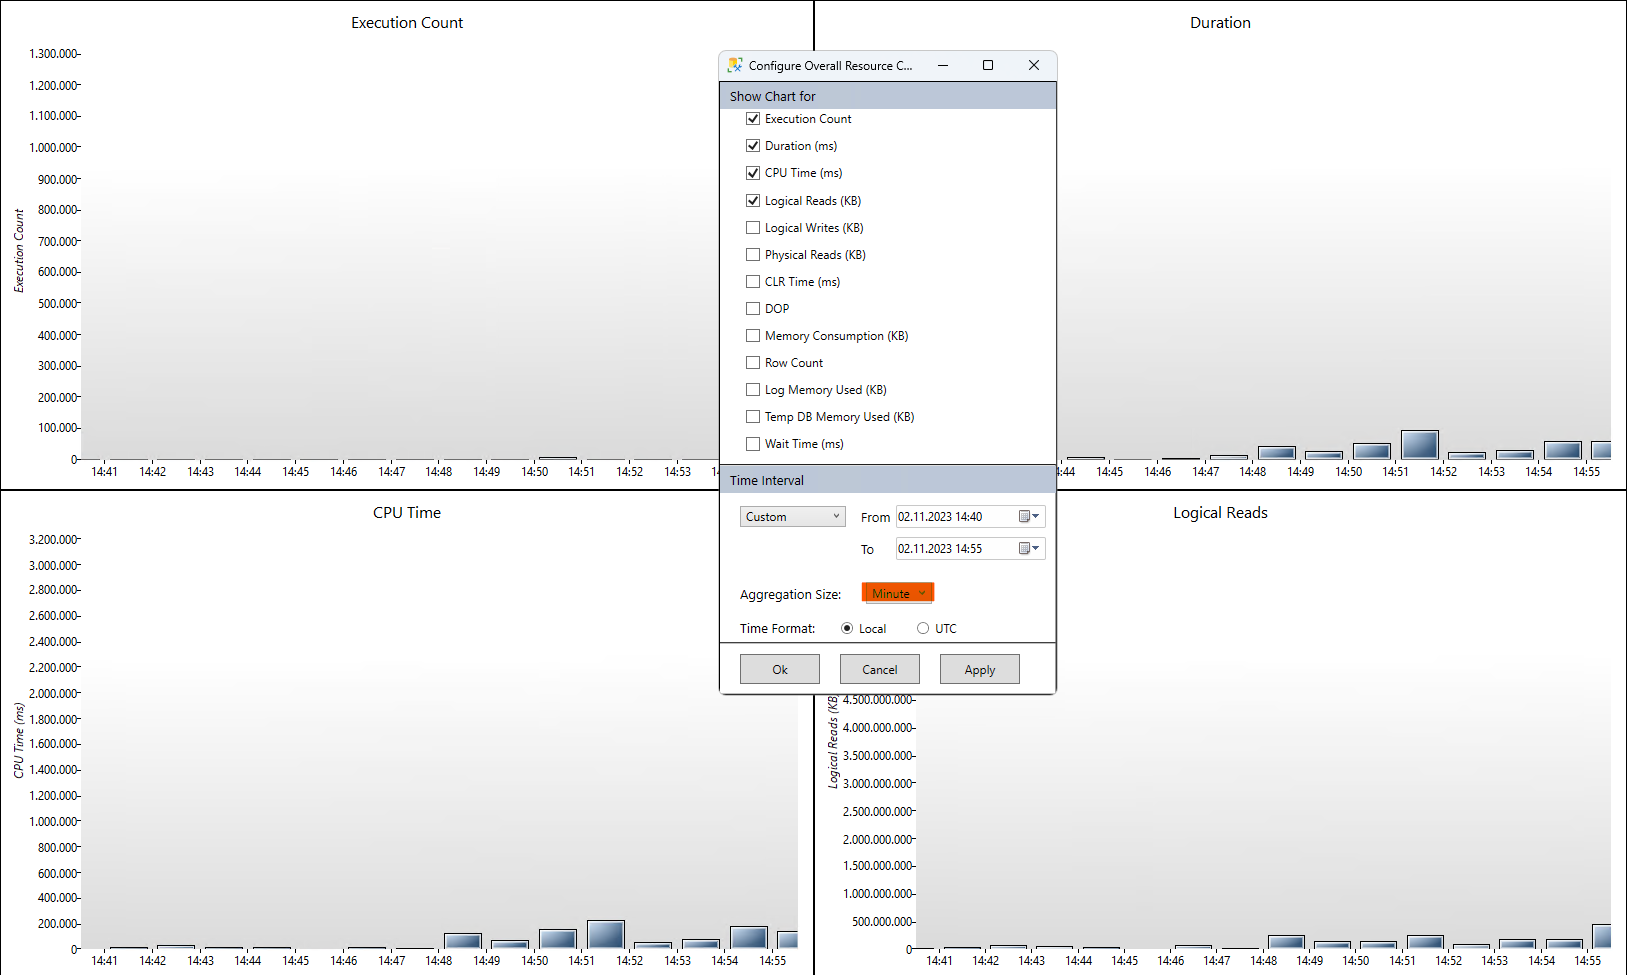
In the database properties under Query Store, the "Statistics Collection Interval" is set to 1 hour. This is also confirmed by querying the view query_store_runtime_stats_interval - all intervals span exactly 1 hour. However, when viewing reports like "Overall Resource Consumption", it is possible to select "Minute" in the dropdown for "Aggregation Size" and it shows data that looks plausible.

I was able to catch a query used in the "Top Resource Consuming Queries Report" and it looks like it displays all plans, that were also executed in the selected 1 minute interval, but the stats still seem to refer to the complete collection interval. So my guess would be to not trust anything for intervals smaller then the collection interval. Am I correct, or do the reports acutally show reliable data?

SELECT TOP (@results_row_count)      
    p.query_id query_id
    , q.object_id object_id
    , ISNULL(OBJECT_NAME(q.object_id),'') object_name
    , qt.query_sql_text query_sql_text
    , ROUND(CONVERT(float, SUM(rs.avg_duration*rs.count_executions))*0.001,2) total_duration
    , SUM(rs.count_executions) count_executions
    , COUNT(distinct p.plan_id) num_plans 
FROM sys.query_store_runtime_stats rs      
JOIN sys.query_store_plan p ON p.plan_id = rs.plan_id      
JOIN sys.query_store_query q ON q.query_id = p.query_id      
JOIN sys.query_store_query_text qt ON q.query_text_id = qt.query_text_id  
WHERE NOT (rs.first_execution_time > @interval_end_time OR rs.last_execution_time < @interval_start_time)  
GROUP BY p.query_id, qt.query_sql_text, q.object_id  
HAVING COUNT(distinct p.plan_id) >= 1  
ORDER BY total_duration DESC

Database Properties/Query Store

Report Overall Resource Consumption

2 Answers 2

4

You can see in the query that what they're doing is catching the stuff from within the interval that has a datetime for first execution or last execution that falls within the more narrow time range of the report. So, it's going to contain some very accurate data. However, if some query was executed within that time frame, but it's first and last execution time falls outside the interval you're interested in, you won't see it. The data stored in Query Store is aggregate only, aggregated by the collection interval. There isn't a second, deeper layer of data or anything like that.

2

Thank you @Grant for confirming that the colleciton interval indeed sets the granularity of the data. I looked into the queries a little more and would like to expand a bit on on the part about accurarcy.

As I understand the query (*), the execution and report intervals only need to overlap for the plan to be listed in the "Top Resource Consuming Queries Report". The accuracy of the data thus very much depends on how often the plan is executed. On a busy application database, the same queries will be used over and over again, basically setting first and last execution time equal to the collection interval. Assuming the number of executions is evenly distributed, the data shown in the report will be off by a factor of 60.

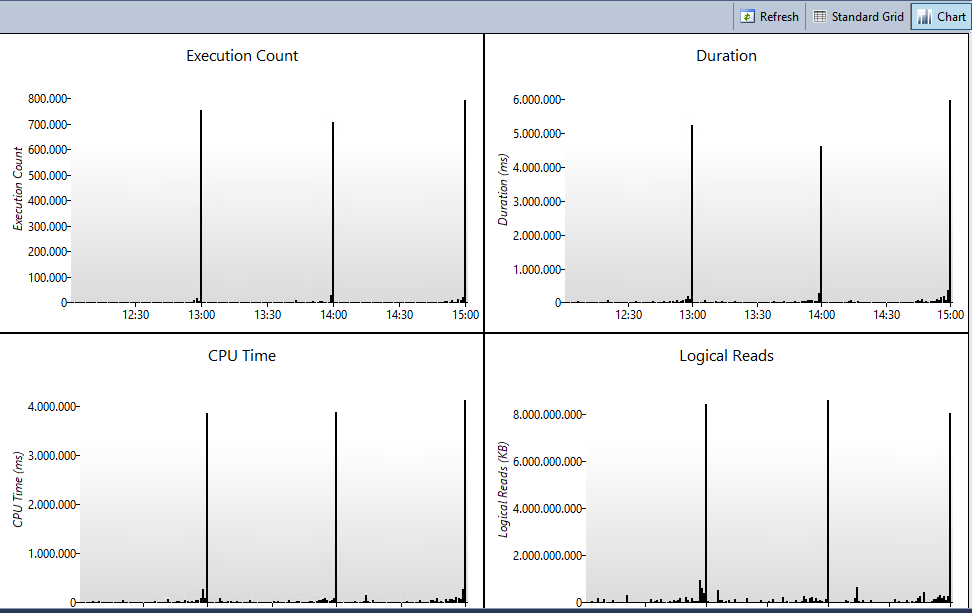
Even more startling is the data from the "Overall Resources Consumption Report": enter image description here

I freaked out the first time I saw these charts. What could possibly causing these peaks on my database at the end of each hour? Luckily, the truth is: the peaks are not real.

The query for the report was posted here, where the crucial part is:

DATEADD(d, ((DATEDIFF(d, 0, rs.last_execution_time))),0 ) as bucket_start,
DATEADD(d, (1 + (DATEDIFF(d, 0, rs.last_execution_time))), 0) as bucket_end

The bucket is determined by the last execution time, which will be equal to the end of the collection interval for a lot of queries as I noted before.

Conclusion: this is a little cautionary tale of how trying to report information, that isn't there, will produce bogus results. Microsoft does not warn you, that you are about to be looking at nonesense. Nor could I find anything on the internet about this issue. So to anyone, who drilled down the reports and found funny looking numbers, relax. Check your collection interval, don't go below it.


(*) NOT(x OR y) is true, when both x and y are false, where

x = rs.first_execution_time > @interval_end_time and

y = rs.last_execution_time < @interval_start_time

meaning the plan has to be first executed before the report end time and vice versa.

0

Your Answer

By clicking “Post Your Answer”, you agree to our terms of service and acknowledge you have read our privacy policy.

Not the answer you're looking for? Browse other questions tagged or ask your own question.