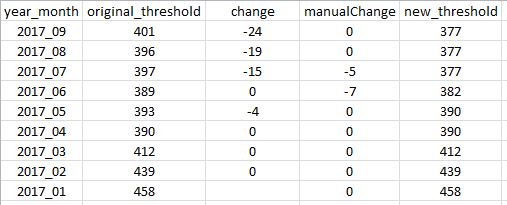
I have the following in Excel which I need to calculate in SQL Server:
The columns that needs to be calculated is change and new_threshold:
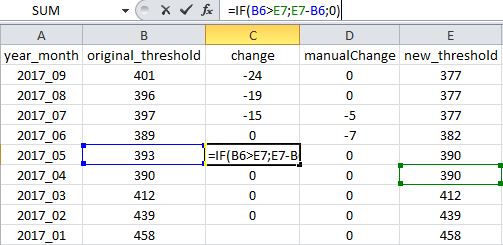
The formula for change is:
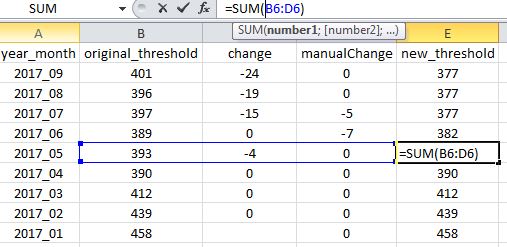
While the formula for new_threshold is:
I have tried to use the lead and lag methods SQL Server offers, but I can't seem to keep track of the calculation.
Here is one thing I've tried:
SELECT
    year_month,
    round(original_threshold, 0) original_threshold,
    round(case when original_threshold > isnull(lead(original_threshold) over (order by [year_month] desc), original_threshold)
        then isnull(lead(original_threshold) over (order by [year_month] desc), original_threshold)  - original_threshold
        else 0 end, 0) change,
    manualChange,
    round(original_threshold + case when original_threshold > isnull(lead(original_threshold) over (order by [program], [year_month] desc), original_threshold)
        then isnull(lead(original_threshold) over (order by [year_month] desc), original_threshold)  - original_threshold
        else 0 end + manualChange, 0) new_threshold
FROM
    [Test].[dbo].[test]
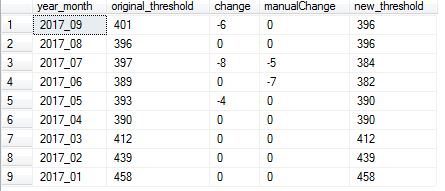
which yields:
Edit:
Here is the insert statement if you want to test it
insert into [Test].[dbo].[test]
(
     [year_month]
    ,[original_threshold]
    ,[manualChange]
)

values
('2017_09', 401,    0),
('2017_08', 396,    0),
('2017_07', 397,   -5),
('2017_06', 389,   -7),
('2017_05', 393,    0),
('2017_04', 390,    0),
('2017_03', 412,    0),
('2017_02', 439,    0),
('2017_01', 458,    0)
Based on the values from this insert, I want to be able to calculate the change and new_threshold like in the Excel above.


