1

I am new to sql server monitoring.Basically system administrator who worked in organisation set monitoring in window server 2012R2 to monitor memory issues in sql server and I am getting following notification and I don't exactly understand where to look for solution.

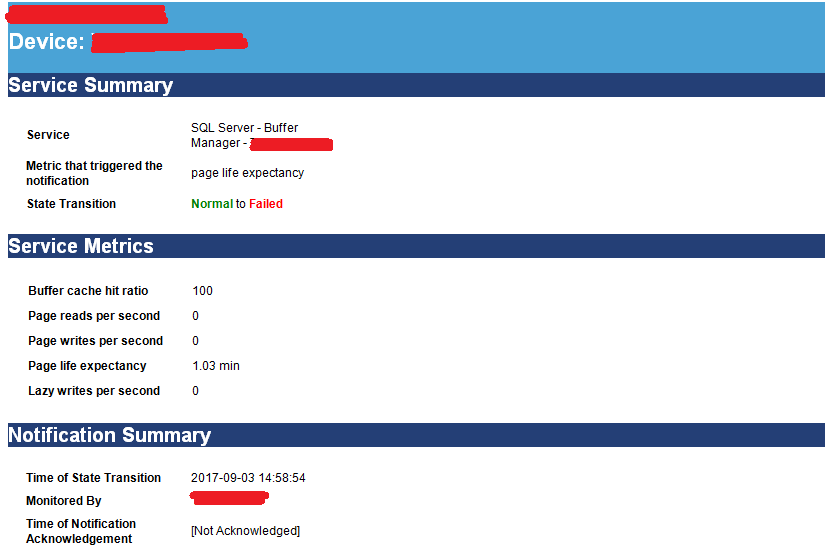
Notification I am getting in email: enter image description here
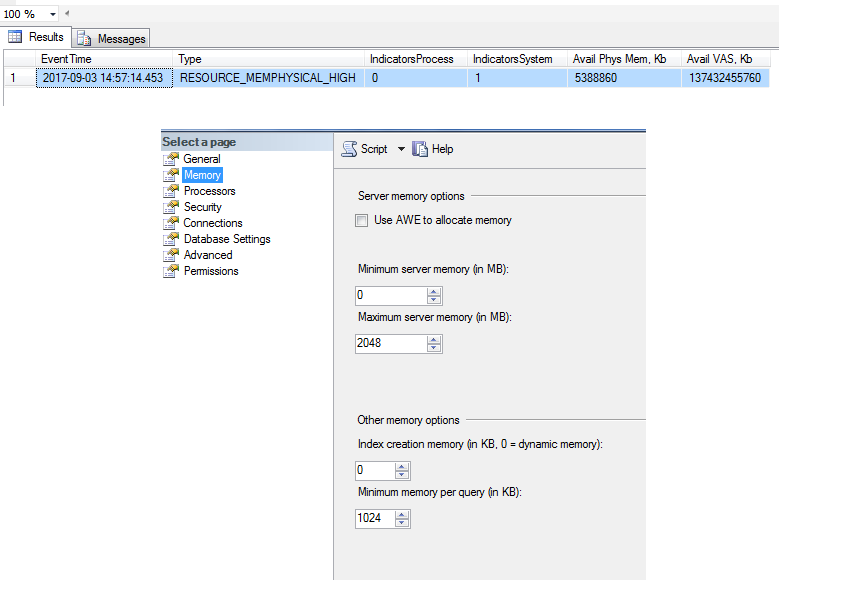
Memory/memory pressure I checked: enter image description here

Seem like there isn't any memory pressure but I don't understand why I am getting page life expectancy state transition (Normal to Failed) ?

Thanks in advance for reading/sharing knowledge/helping.

Update in question as requested:

Select @@version result: Microsoft SQL Server 2008 R2 (SP3) - 10.50.6000.34 (X64) Aug 19 2014 12:21:34 Copyright (c) Microsoft Corporation Standard Edition (64-bit) on Windows NT 6.3 (Build 9600: ) (Hypervisor)

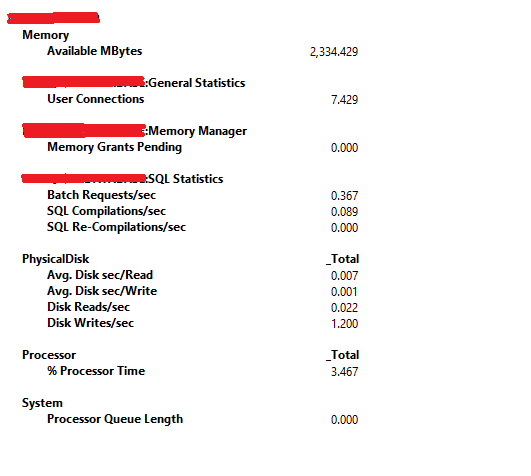
Other useful information: enter image description here

Result of :

select cntr_value from sys.dm_os_performance_counters where object_name LIKE '%Manager%' and counter_name = 'Page life expectancy'

SELECT DISTINCT memory_node_id FROM sys.dm_os_memory_clerks Where memory_node_id<64 

cntr_value = 788645; memory_node_id = 0;

I am running two instances on server and Window server 2012R2 is OS with 6GB RAM.

3
  • Please add the output of select @@version in the question.
    – Shanky
    Commented Sep 12, 2017 at 7:55
  • What does PLE failed mean in your monitoring system? At what value does it transition from normal to failed? how big is your databases and what kind of workload does it run? Monitor PLE value over an entire business cycle, possibly its going down when you have a heavier than usual workload running during a particular time of the day?
    – DMDM
    Commented Sep 12, 2017 at 10:12
  • @jesijesi all your question are valid I don't know how to get value at the time of fail.my database is 1GB. It runs full backup start of month and diff backup every 2 hour between 9am and 9pm additionally two users remotely connect to sql server via ssms and lastly 2 users have access to sql server via ms access to run select queries.
    – shaadi
    Commented Sep 12, 2017 at 23:38

1 Answer 1

1

cntr_value = 788645

Your PLE is 788645, that is perfect and even more: it reflects that your server happily doing nothing.

So, don't worry and don't look your monitoring tool: it reflects something known only to its author

P.S. 788645 seconds = 9,... days, that is right, yor image also shows 2017-09-03 that, I think, is server last restart time. Since that day no more than 2Gb of data was passing through your buffer pool and it's still there, so, one more time: no memory pressure, no working activity on this server.

1
  • seems like your answer is valid so far I uploaded a snapshot of performance monitor(15 mins) do you see any problem in stats?
    – shaadi
    Commented Sep 13, 2017 at 2:34

Your Answer

By clicking “Post Your Answer”, you agree to our terms of service and acknowledge you have read our privacy policy.

Not the answer you're looking for? Browse other questions tagged or ask your own question.