I am using Microsoft SQL Server 2016 (SP2-GDR) (KB4505220) - 13.0.5101.9 (X64) Jun 15 2019 23:15:58 Copyright (c) Microsoft Corporation Standard Edition (64-bit) on Windows Server 2012 R2 Standard 6.3 (Build 9600: )
The database is about 870 gb in size. It's SQL Standard and I have 128 gb of RAM on the server. The database is on SSD drives. The Data file is on a different drive than the log file and Tempdb has it's own SSD drive as well. The Server gets about 1200 queries/seconds in average, it can go as high as 2000 queries/second. Recompilation stays low, only 1 to 8 per second. Page life expectancy is good, averaging 61 minutes.
The Server has 6 physical cores + hyper threads.
We are using SQL Server's Change tracking a lot on a system where thousands of device connect and try to synchronize changes with the tracking key.
It usually runs fine, but then, from time to time, one day or another, the server's latches will skyrocket, going from 0ms to an average of 60677ms.
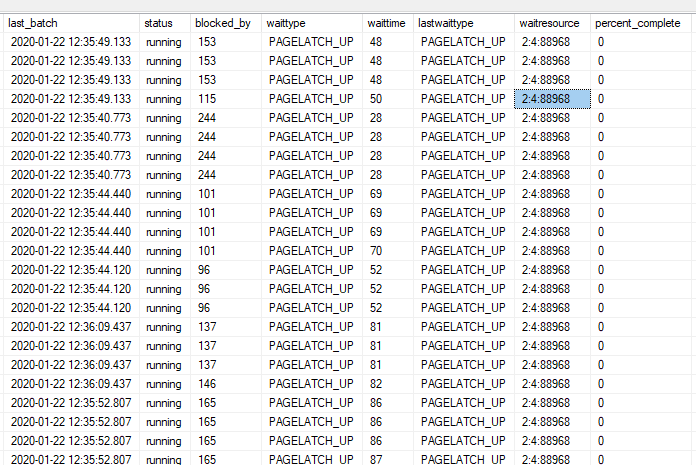
When I check what queries are running, all I can see are the synchronization queries, all blocked, with "PAGELATCH_UP", all trying to access the change tracking tables, more than 300 queries blocked.
I have a few questions:
- Does SQL Server locks the whole table while looking up change tracking changes?
- Would I have better results with SQL Entreprise or it doesn't change anything?
- Any idea why does the change tracking works well most of the time but crashes without apparent reason from week to week?
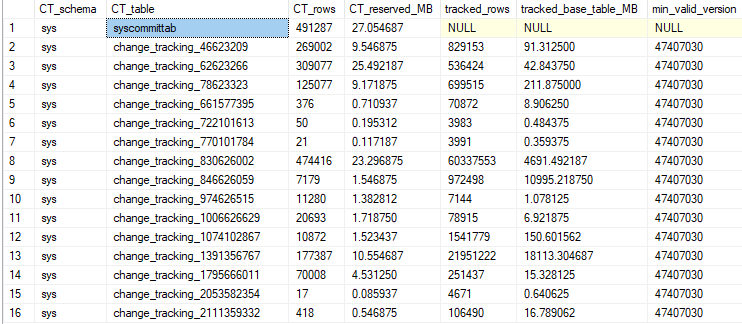
Those are my change tracking table size. The tables that my query blocks on are the three first ones, only a few mb of data.
They are all waiting on the same waitresource.
Waitresource 2:4:88968 is in the tempdb. But tempdb is only responsible for about 9% of the writes of the server and 6% of the reads.
But my query doesn't use the tempdb so I guess that it's like that because of the internal way change tracking works? Here is my query
DECLARE @Id INT; SET @Id = (SELECT Id FROM Users WHERE No=@No);

SELECT DISTINCT lh.Key1
FROM (
    SELECT Key1 FROM CHANGETABLE(CHANGES dbo.Table1, @TrackingKey) AS CT
    UNION ALL
    SELECT Key1
    FROM dbo.Table2 lhd
    INNER JOIN (SELECT Key2 FROM CHANGETABLE(CHANGES dbo.Table2, @TrackingKey) AS CT) AS CTLHD ON(CTLHD.Key2=lhd.Key2)
    UNION ALL
    SELECT Key1
    FROM CHANGETABLE(CHANGES dbo.Table3, @TrackingKey) AS CT
) AS L
JOIN dbo.Table1 lh ON lh.Key1 = L.Key1
WHERE lh.Id = @Id AND lh.Date BETWEEN @StartUtc AND @EndUtc
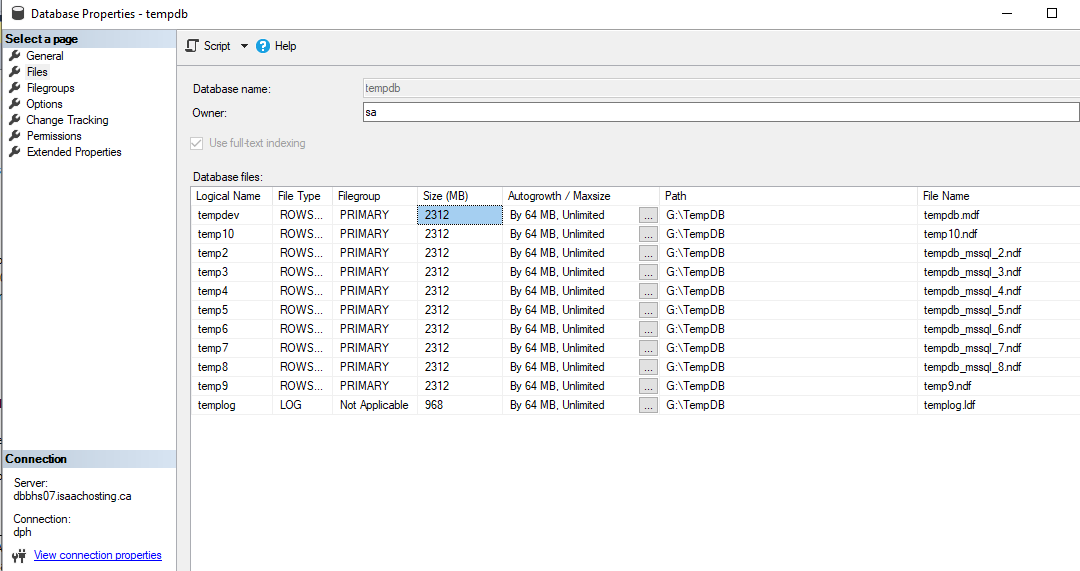
My tempdb has 10 files and they are the same size.
What I usually end up doing to get the client back to normal is put it in down time, then put him back up gradually so that all the mobile devices get to synchronize little by little. But our system is mission critical and this is not a long term solution.
Another solution I've been thinking about is changing the way the system works with change tracking queries. Have the mobile device synchronize with a "home made" table and fill this table with a single service reading change from change tracking. That way I'll limit the concurrent queries to the change tracking tables but I'm afraid that I'll just move the problem to the home made table instead.
Any thoughts on this? Any help will be appreciated.
EDITED : Head blocker
I tried to determine who is the head blocker and what it's waiting on but it's a hard task. It seems I have many "head blockers".
All the queries are running the same SELECT, almost all split in 4 threads, for some queries they are not blocked at all but waiting on "MISCELLANEOUS", but for some queries, at least part of the threads are blocked by other queries.
For example, right now, 294 threads are showing.
Query 202 is split into 4 threads and one of it's threads is blocked by 123 but the other threads are not blocked. The three threads are waiting on "MISCELLANEOUS" and the blocked thread is waiting on "PAGELATCH_UP"
As for query 123, it's not blocked, it's 4 threads are waiting on "MISCELLANEOUS"
Or for example, query 219 is blocked by query 140 on one thread, and blocked by 69 on the three other threads.
69 is blocked by 193, and 193 is running, waiting on "MISCELLANEOUS" again. 140 is not in the list anymore so it either timed out or completed.
My cost threshold for Parallelism is 70.
Locks 0
Max Degree of Parallelism 3
Query wait -1
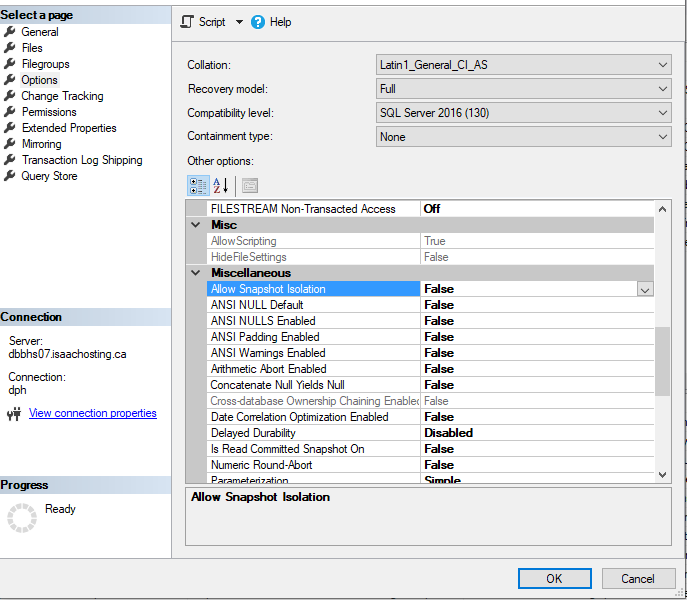
Snapshot isolation level is not enabled on the database. Queries are not using snapshot isolation level.
I also checked at the statistics on the tables, and even on the sys.change_tracking tables. Index on the tables are not fragmented (less than 10%) for the tables queried.
I ran one or two queries and generally the result of the query is 4 rows, which become only one row because of the DISTINCT clause. So it's not like it's returning thousands of rows.
When I run the query in SSMS it's fast and doesn't block even if I currently see hundreds of blocked queries on the server on the same query. So I guess it could be related to parameter sniffing maybe??
Here are the I/O statistics when I execute it in SSMS.
SQL Server Execution Times:
   CPU time = 0 ms,  elapsed time = 0 ms.
SQL Server parse and compile time:
   CPU time = 92 ms, elapsed time = 92 ms.
Table 'Users'. Scan count 0, logical reads 2, physical reads 0, read-ahead  reads 0, lob logical reads 0, lob physical reads 0, lob read-ahead reads 0.

(1 row affected)

 SQL Server Execution Times:
   CPU time = 0 ms,  elapsed time = 0 ms.

(1 row affected)
Table 'Worktable'. Scan count 0, logical reads 0, physical reads 0, read-ahead reads 0, lob logical reads 0, lob physical reads 0, lob read-ahead reads 0.
Table 'Workfile'. Scan count 0, logical reads 0, physical reads 0, read-ahead reads 0, lob logical reads 0, lob physical reads 0, lob read-ahead reads 0.
Table 'syscommittab'. Scan count 3, logical reads 555, physical reads 0, read-ahead reads 0, lob logical reads 0, lob physical reads 0, lob read-ahead reads 0.
Table 'change_tracking_62623266'. Scan count 1, logical reads 3364, physical reads 0, read-ahead reads 0, lob logical reads 0, lob physical reads 0, lob read-ahead reads 0.
Table 'Table1'. Scan count 3, logical reads 9, physical reads 0, read-ahead reads 0, lob logical reads 0, lob physical reads 0, lob read-ahead reads 0.
Table 'Table2'. Scan count 0, logical reads 34281, physical reads 0, read-ahead reads 0, lob logical reads 0, lob physical reads 0, lob read-ahead reads 0.
Table 'change_tracking_46623209'. Scan count 1, logical reads 1152, physical reads 0, read-ahead reads 0, lob logical reads 0, lob physical reads 0, lob read-ahead reads 0.
Table 'change_tracking_78623323'. Scan count 1, logical reads 1077, physical reads 0, read-ahead reads 0, lob logical reads 0, lob physical reads 0, lob read-ahead reads 0.

(1 row affected)

 SQL Server Execution Times:
   CPU time = 296 ms,  elapsed time = 435 ms.
SQL Server parse and compile time:
   CPU time = 0 ms, elapsed time = 0 ms.

 SQL Server Execution Times:
   CPU time = 0 ms,  elapsed time = 0 ms.

Completion time: 2020-01-22T14:18:25.9480651-05:00
Here is my query plan https://www.brentozar.com/pastetheplan/?id=By7k-7UWI
But again, that's the version that doesn't block. I have the query store enabled so I could try to get the version that blocks, I'm just not 100% how to do it.
EDITED : QUERY STORE INFO
My query is the first in the "Regressed queries" of the Query Store.
According to the Query store, here is the "bad plan" https://www.brentozar.com/pastetheplan/?id=ryqKGQUbL
And here is the "good plan" https://www.brentozar.com/pastetheplan/?id=rknnGQ8WL
Should I just "force" the good plan?
EDITED My solution
Ok so I've used Brent Ozar's sp_blitzcache (https://www.brentozar.com/blitz/) with "expert_mode" at 1 to be able to retrieve the "bad plan"'s handle and to be able to clear it from cache (without clearing anything else).
DBCC FREEPROCCACHE (0x06000800155A5106F08F632F1C00000001000000000000000000000000000000000000000000000000000000);
My server is back at normal state again and all the hundred of blocked queries are gone. I guess it's parameter sniffing then? Hoping it doesn't happen again. Would like to find a way for it not to happen again.


