I have a select statement within a procedure that is causing me some grief at the moment. The query estimates about 100 million rows and that in turn grants large chunks of memory (about 8 gigs per procedure call), which then in turn results in extreme memory pressure on the database instance.
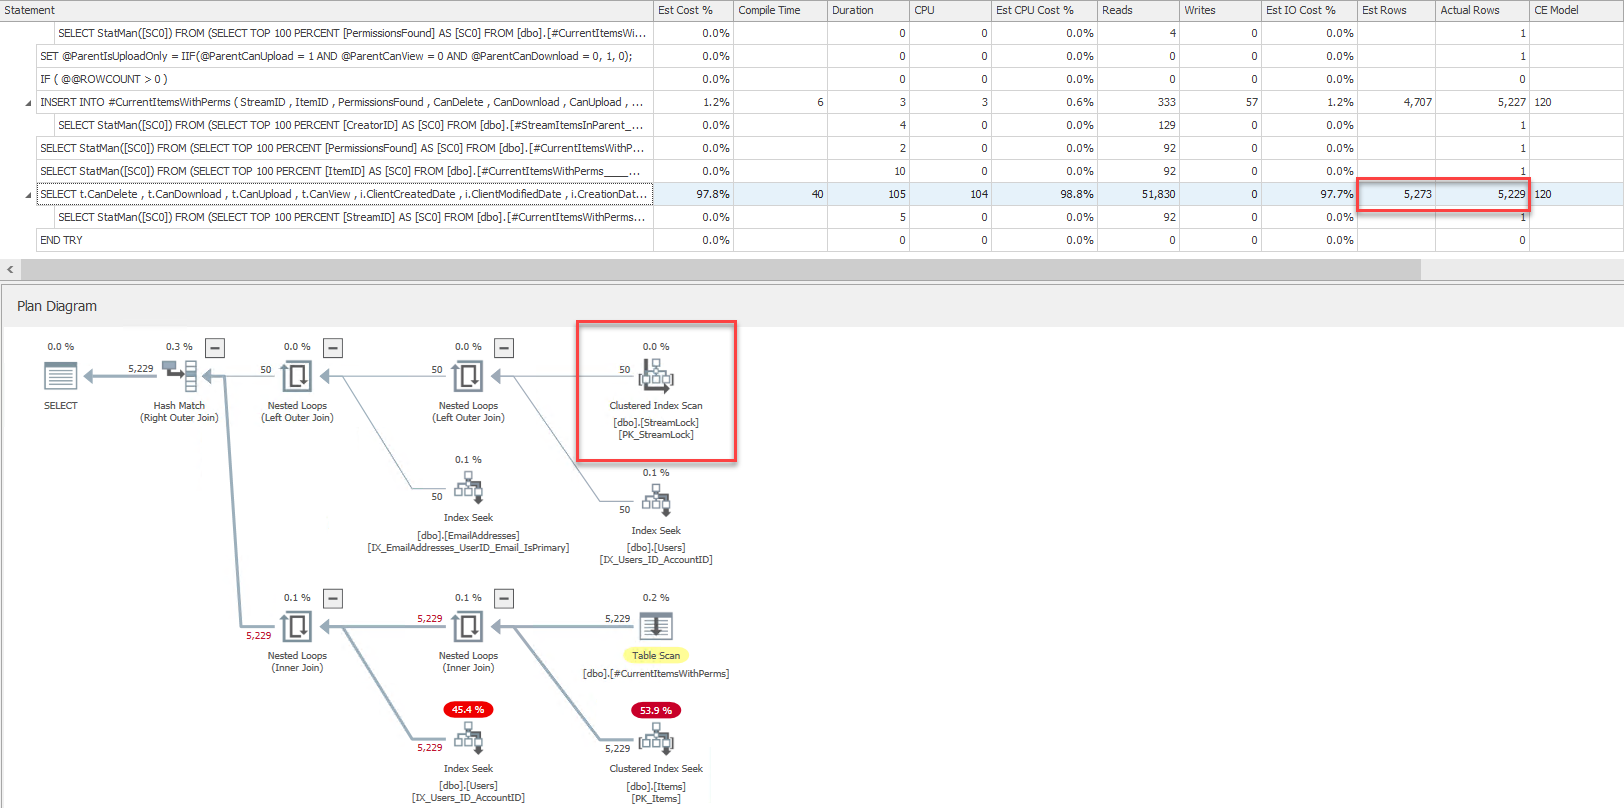
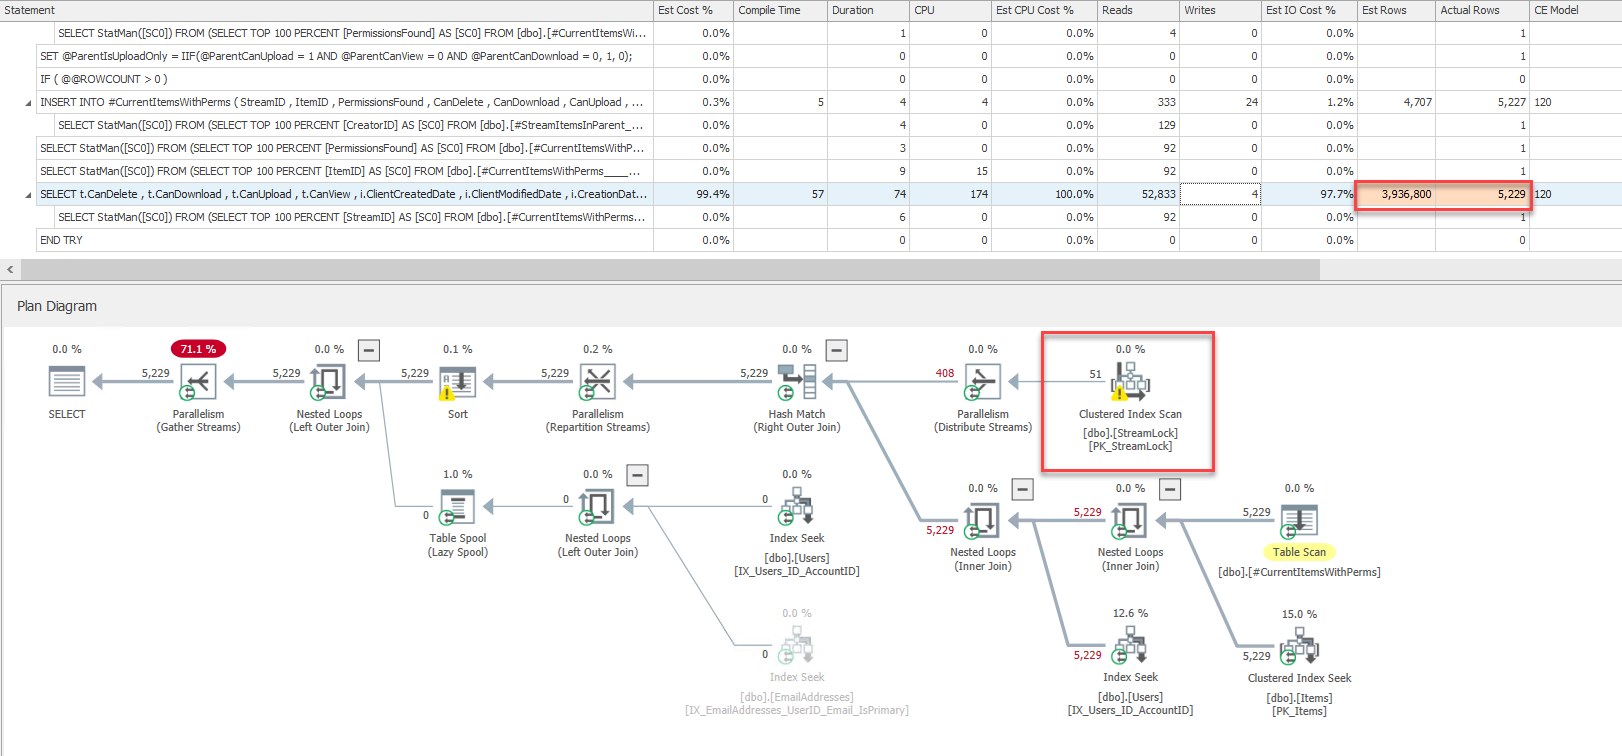
When the CE model is 120 (the instance is on SQL Server 2014 SP3, CU4 by the way), I get the following estimates
At the same time if I set the CE model to 70 using QUERYTRACEON 9481, I get perfect estimates
I'm very interested to understand why changing to an older CE model gives me a better estimate for the query.
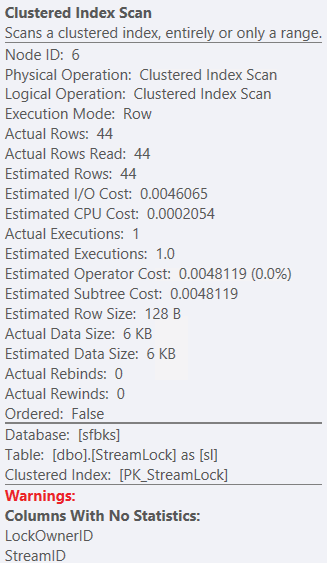
Additionally, I also see bizarre columns with no statistics warnings.
But at the same time I can see that I do have statistics for those columns in my table. I also tried creating a multi-column statistic, figured I'd give that a try as well. But it didn't really help either.
If I update the statistics, the issue almost immediately resolves btw and it creates a better new plan (to make sure a recompile isn't really that resolves the issue, I did remove the procedure and plan hash from the cache before updating the stats )
This is the select statement in question:
SELECT
    t.CanDelete
  , t.CanDownload
  , t.CanUpload
  , t.CanView
  , i.ClientCreatedDate
  , i.ClientModifiedDate
  , i.CreationDate
  , uc.FirstName AS CreatorFirstName
  , i.CreatorID
  , uc.LastName AS CreatorLastName
  , i.ExpirationDate
  , i.FileCount
  , i.FileName
  , i.FilePath
  , i.FileSizeBytes
  , i.Hash
  , t.ItemID AS ID
  , sl.ExpirationDate AS LockExpirationDate
  , sl.LockID
  , ea.Email AS LockOwnerEmailAddress
  , ul.FirstName AS LockOwnerFirstName
  , sl.LockOwnerID
  , ul.LastName AS LockOwnerLastName
  , sl.StreamLockTypeID AS LockTypeID
  , i.Name
  , i.ProgenyEditDate
  , t.StreamID
  , i.[Type]
 FROM #CurrentItemsWithPerms t
  INNER JOIN dbo.Items i
   ON i.ID = t.ItemID
  INNER JOIN dbo.Users uc
   ON uc.ID = i.CreatorID
  LEFT OUTER JOIN dbo.StreamLock sl
   ON sl.StreamID = t.StreamID
  LEFT OUTER JOIN dbo.Users ul
   ON ul.ID = sl.LockOwnerID
  LEFT OUTER JOIN dbo.EmailAddresses ea
   ON ea.UserID = ul.ID
   AND ea.IsPrimary = 1
 WHERE
  t.ItemID <> @ParentID
  AND t.PermissionsFound = 1
Query plan for CE model 120: click here
T2363 Results for CE model 120 (in case it helps): click here
Query plan for CE model 70: click here
So, just to summarize my questions:
- Why does the old CE model do a better job in estimating the rows in this case?
- Why am I seeing warnings related to missing statistics when they are already present?
Thank you.
Edit: Paste the plan links aren't rendering properly, added gists instead. Also included output for CE 120 with T2363 turned on.
Edit2: An update - As Josh pointed out, I enabled T4199 and it makes an enormous difference in memory grants, from 8 gigs down to 50 megs. Although the estimates are still wacky and more importantly I still get those pesky warnings about "columns without statistics". There are no warnings when I use the old CE model. So, I'm still wondering why am I getting those even with T4199 turned ON? Plan XML with T4199 available here
An additional note - The statistics were sampled when there were only 4 rows in the table. 40 more rows were added since then. If I update the stats manually, the warning goes away and it creates a new different plan with really good estimates (IIUC the stats won't update automatically until the rowmodctr hits 500 for tiny tables). If the stats were truly out of date, (goes back to the previous question), why doesn't the old CE model reflect that? Plan XML with just the updated stats available here
Edit3: So, I took another look at this, and it certainly looks like my statistics for the the tiny table was out of date. I couldn't find this documented, but it looks like if my table has less than 500 rows, then the statistics becomes outdated after the rowmodctr is modified 10x the times of the sampled value. For example: if my table was sampled at 5 rows, I get a new plan (and a terrible one) when the total number of rows hits 51.
Here are a couple of screenshots that shows this behavior:
I was able to reproduce this behavior until sampling value equaled 49. So, at rowcount=490 I have a good plan, and as soon the row count is at 491, I get a sub optimal plan. So, I guess I will have to adjust my update statistics job a bit, perhaps even create an exception to frequently update it than my other tables.


