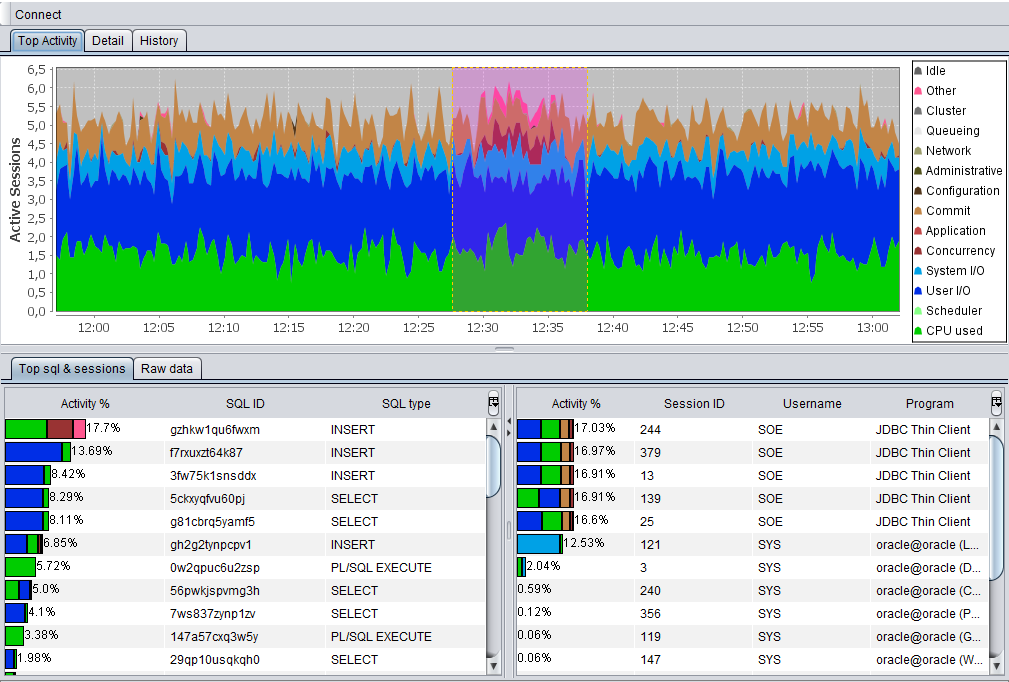
This is a complex question but I will try to summarize and generalize.
The green is CPU used and CPU wait. If CPU used is 100% (in terms of how many cores you have; this shows up in the OEM Top Activity graph which is similar to the ASH report) then your CPU starts waiting and this causes performance problems. You would want to use your CPU as much as possible, but not at 100% because this causes the server to "flatline" and creates a queue of users waiting for CPU response. There are other classes of wait events that would cause CPU to wait, such as concurrency locks, as this is bad for performance. So if something shows more green, then yes it uses more CPU and this is not necessarily bad unless there are other sessions waiting for the resources it is using.
The blue is I/O usage and wait, and for the same reasons you want your sessions to consume I/O resources up to a point, and not have other sessions wait for I/O reads and writes.
Your orange is commit wait. You don't want your SQL to over-commit because this writes an excessive amount into the redo logs and in turn archive logs.
Now the memory usage is where it gets complex. There are different layers of memory and cache. Generally you want to read data from memory buffers rather than disk, and there are usually layers of cache on your operating system and I/O subsystems that help Oracle access commonly used data, and get cache hits. The cache buffers in oracle are in the SGA (or server memory) and you want to get cache hits as far as possible here. Reads from these buffers are regarded as 'consistent' and will show up as green. Reads from disk are 'physical' and show up as blue.
Then you have PGA and UGA which are user areas of memory on the server and the client. If PGA usage becomes too large and exceeds the amount of memory on the server, your operating system goes into 'swap' and reads from disk, and this can cause severe performance backlogs. Your reads from SGA cannot go into swap because SGA is pre-allocated memory on startup of the database.
So in general your total resource pool consists of CPU, I/O and memory and there is a complex relationship between them. You want to use each resource up to a point, but keep enough free for contingencies. If optimizations are done and resource usage is consistently near 100% then it's time for more optimization or splitting/upgrading servers. Oracle RAC (clustering) is sometimes used to address these complex problems.

