My configuration is:
Compute
- AWS ECS cluster with a Django based API (Using ORM). 1vCPU and 4GB of memory per container.
Database
- RDS MariaDB
db.t3.mediuminstance (2 vCPU, 4GB of memory) gp3type storage (3000 IOPS provisioned, 125Mib/s base throughput)- Tables information:
table_name_1:48columns of mostlyVARCHAR(50~250)with49977rowstable_name_2:5columns ofINTandDATETIMEwith49977rowstable_name_3:40columns ofINT,VARCHAR,DOUBLEwith656904rowstable_name_4:32columns ofINT,VARCHAR,DOUBLEwith727477rows
- RDS MariaDB
Test case:
140 WEB clients are active at same time and continuously sending GET requests for 1 minute at two API URLs (70 clients per URL) with same query parameters per URL:
- First URL is executing only
SELECTSQL queries. Most complicated one is:
Query details:SELECT `table_name_2`.`id`, `table_name_2`.`table_name_1_id`, `table_name_2`.`param_1`, `table_name_1`.`id`, `table_name_1`.`param_1`, `table_name_1`.`param_2` FROM `table_name_2` INNER JOIN `table_name_1` ON ( `table_name_2`.`table_name_1_id` = `table_name_1`.`id` ) INNER JOIN `table_name_3` ON ( `table_name_1`.`id` = `table_name_3`.`table_name_1_id` ) WHERE ( `table_name_1`.`param_1` >= 100 AND `table_name_1`.``param_1` <= 200 AND `table_name_1`.`param_2` >= 100 AND `table_name_1`.`param_2` <= 200 AND `table_name_3`.`param_3` >= 10000 AND `table_name_2`.`param_4` >= 10000 ) GROUP BY `table_name_2`.`id` ORDER BY NULL- total number of resulted rows for
SELECTis234 - number of rows after first
JOINis49977 - number of rows after second
JOINand beforeGROUP_BYis998
- total number of resulted rows for
- Second URL is executing
SELECTandUPDATESQL queries. Where slowUPDATEis:
Query details:UPDATE `table_name_4` SET `parameter_1` = CASE WHEN (`table_name_4`.`id` = 810982) THEN 0 WHEN (`table_name_4`.`id` = 810983) THEN 0 WHEN (`table_name_4`.`id` = 811066) THEN 0 WHEN (`table_name_4`.`id` = 811075) THEN 0 WHEN (`table_name_4`.`id` = 811076) THEN 0 WHEN (`table_name_4`.`id` = 811077) THEN 0 WHEN (`table_name_4`.`id` = 811078) THEN 0 WHEN (`table_name_4`.`id` = 811079) THEN 0 WHEN (`table_name_4`.`id` = 811103) THEN 0 WHEN (`table_name_4`.`id` = 811159) THEN 0 ELSE NULL END, `parameter_2` = CASE WHEN (`table_name_4`.`id` = 810982) THEN 0 WHEN (`table_name_4`.`id` = 810983) THEN 0 WHEN (`table_name_4`.`id` = 811066) THEN 0 WHEN (`table_name_4`.`id` = 811075) THEN 0 WHEN (`table_name_4`.`id` = 811076) THEN 0 WHEN (`table_name_4`.`id` = 811077) THEN 0 WHEN (`table_name_4`.`id` = 811078) THEN 0 WHEN (`table_name_4`.`id` = 811079) THEN 0 WHEN (`table_name_4`.`id` = 811103) THEN 0 WHEN (`table_name_4`.`id` = 811159) THEN 0 ELSE NULL END, `parameter_3` = CASE WHEN ...- updating
10rows - Execution time is
10~15mswhen executing manually - total number of cases is
10
- updating
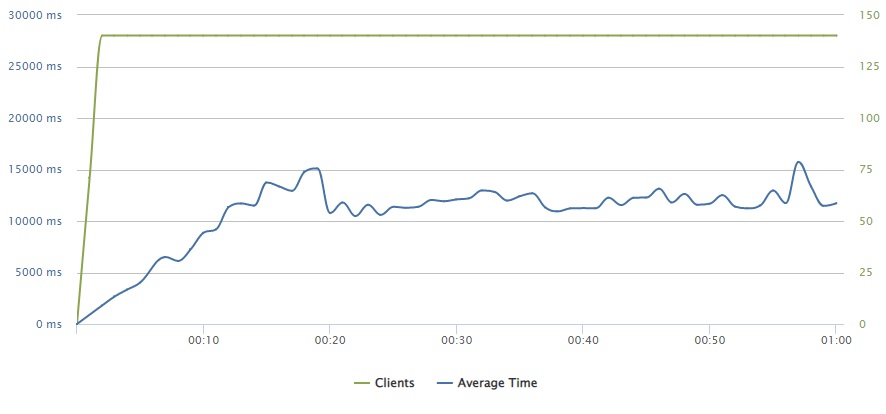
Here is a graph of service response time:

We have 140 active clients and 12s average response time (for 2 containers)
So real average throughput is 140 / 12 = ~12 requests/s
In case of 6 containers average response time is about 6s
Here are two peaks on the DB performance graph:

Two tests with different configuration:
6running ECS containers2running ECS containers
Here is an additional graph for same time range:

Questions:
- Average active sessions number is bigger for
2containers. What is means that query per container running time is slower for2containers (waiting queries of2containers accumulates faster than6containers is executing new queries with less wait time). Why may it happen? DB is waiting for some kind ofDjangoquery complete confirmation, butDjangoresponse is slower in case of2containers (because of server load)? - In case of
2containerswait/io/table/sql/handlerwait event is extremely slow (this event is related toUPDATEquery below), but in case of6containerswait/synch/rwlock/innodb/btr_search_latch(related toSELECT) needs much more time thanUPDATEquery. Why are latency reasons changing depending on application computing performance? - Any other suggestions what I should check based on this graph.
- How this graph should be correctly interpreted (if it possible without knowing other system logs)?
Improving of weird SQL queries above is not an object of discussion

long_query_timeand turn on the slowlog. With the queries in hand, things might be clearer. This would give the timeframes.SHOW CREATE TABLEwould provide more info.WHEREclause on the Update. And whether it had aJOIN.slowquerylog is empty. Even if I setlong_query_time = 0.5. But when I see RDS Performance monitor it shows me:Avg latency (ms): 10606.27forUPDATEquery and667.72forSELECTquery ② → If I correctly understand your question, then yes. Let’s say 140 simultaneous invocations ofcurlcommand per second (70 per URL). Number of connections in peak is about ~1000 (3000max_connectionsis allowed). Yes, it is high, but I don't expect fast response for current test. ⓷ → addedTables informationandQuery details. I hope it will help