I'm using logical replication to move data from server X to Y. We had a hiccup on server X that caused the replication to fall severely behind. We don't know what it was, and right now I'm trying to get things back on track. The replication is trying to replicate a little over 200 tables, some of them very large, as well as a large number of mat views that are recalculated nightly. There shouldn't have been many changes to the tables.
I look at AWS performance monitoring as well as pg_stat_activity to see what replication is doing, and I see our one PID in pg_stat_activity for replication and a consistent, yet low volume of activity for that SQL in AWS. There's also a lot of network bandwidth available to send.
I naturally want to see if I can speed things up.
I found an article that describes the various parameters that I can configure, and I wanted to ask about what kind of response I should see. My objective is to raise the number of workers in pg_stat_activity for replication, if possible. Right now I see only 1 for the publisher.
- max_wal_senders: 25 on both publisher and subscriber
- max_worker_processes: 10 on both publisher and subscriber
- max_logical_worker_processes: not present in my version of Postgres (13)
- max_replication_slots: 10. I'm using 1.
- wal_receiver_timeout: 10 min.
I check pg_stat_replication too to see the *_lsn values, and here's what I see.
- send_lsn: 2F036/680AAAC8
- write_lsn: 2F127/596E8EC0
- flush_lsn: 2F127/596E8EC0
- replay_lsn: 2F127/596E8EC0
What's confusing to me here is why is send_lsn behind the rest of the *_lsn values? Shouldn't the sent value be greater than the stuff written/flushed to disk?
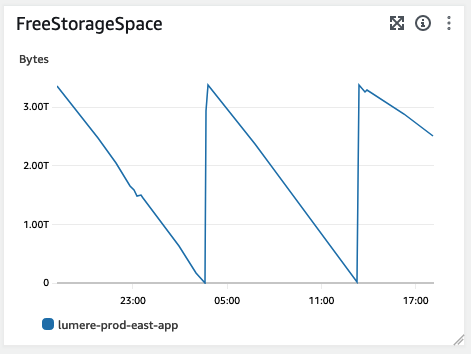
Finally, I see our free space on the device sawtoothing. It did this all weekend.

Am I going down the right track? I want to push the pedal to the metal here.
