in_process
I will update my answer when you post the index definition of IDX_gldSubDetails_Compound_1, but the best you might be able to do with it is switch the key column order of AccountID and TransactionDetailID, and that might not buy you much.
Part of the problem you're having is in the wait stats from your query plan:
<Wait WaitType="PAGEIOLATCH_SH" WaitTimeMs="12762412" WaitCount="3170642" />
<Wait WaitType="PAGEIOLATCH_EX" WaitTimeMs="796191" WaitCount="194957" />
Compare that to how long the query took:
<QueryTimeStats CpuTime="789518" ElapsedTime="14188790" />
It is worth noting that your query has 789 seconds of CPU time and 14,188 seconds of wall clock time here, because ideally a parallel plan will use more CPU to decrease wall clock time.
There may be additional waits not logged in the plan XML that would help account for the time disparity. You'd have to collect those using sys.dm_exec_session_wait_stats, if you feel like waiting another four hours.
Focusing on what I can see, you spent
- 12,762 seconds plus
- 796 seconds
Reading pages from disk into memory in a query that has a duration of 14,188 seconds. Some of that timing is inflated because of parallelism (multiple threads waiting on reads simultaneously).
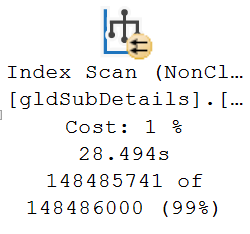
Note the ~30 seconds it takes to fully read this table from disk:

This server may just not have enough memory in it for the amount of data you're expecting it to deal with. If you're able to allocate more, you could do somewhat better in a few parts of the plan.
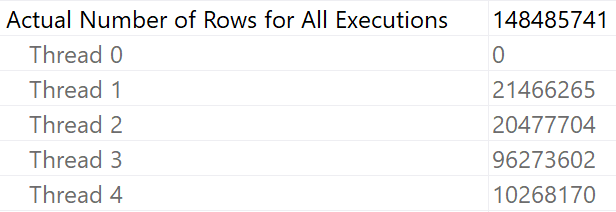
Adding to your woes is bad thread distribution going into the hash join:

Three threads handled 1-2 million rows, and one thread handled nearly 10 million rows.
If you're able to run this query at a higher degree of parallelism, you might get better thread distribution/hash bucketing for the join. Since you can't change the query, that would mean changing the database- or instance- level MAXDOP setting to 8.
But all that only gets you a little bit faster:

Significant operator times in this plan are approximately:
- 30 seconds reading
gldSubDetails
- 30 seconds at the lopsided hash join
- 20 seconds spilling at the sort
- 3 hours 55 seconds at the update
Since this plan is all row mode, operator times are cumulative going from right to left. You can sort of ignore time in the parallel exchanges, since they can are often wonky.
If you were able to change the query at all, I could make several recommendations like batching the updates into smaller chunks, dumping the initial set of joins into a #temp table and updating off of that, on top of what has been mentioned in the comments.
Unless you can make changes to the server hardware (memory, CPU), you might be stuck with this lame duck.
- More memory would cut down on time reading pages and spilling at the sort
- More CPUs would allow for a higher DOP which would speed up reads and get you better row/thread distribution and hash buckets at the hash join
As a side note, you're on SQL Server 2016 RTM. 16.0.1000.6, from the plan XML, which is terribly out of Microsoft support. It will not fix anything performance-wise to update it, but it helps viewers understand how well tended to this server is.
You may be the only one who cares at all about it, and you may not be able to do much to help things. I've probably spent more time writing this answer than anyone has spent administering it in the last eight years.


