2

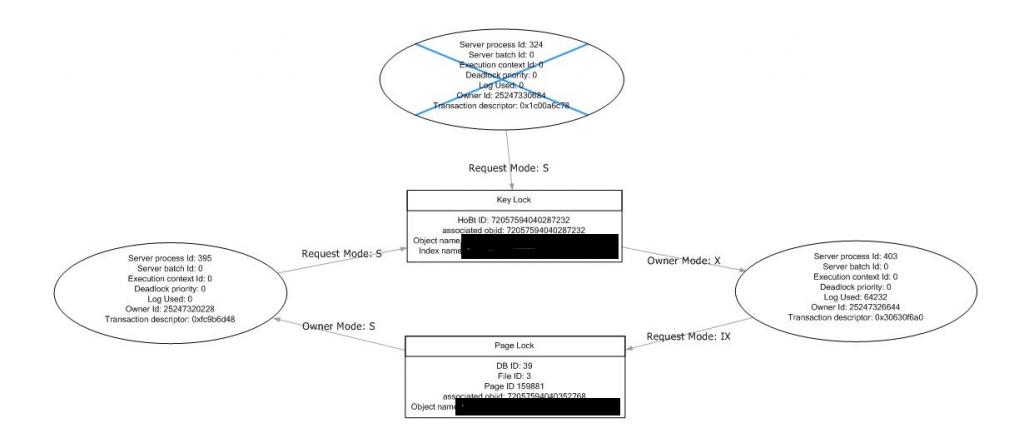
I have been seeing a lot of deadlocks occurring on a system with deadlock graphs similar to this one:
enter image description here

I have been advised that it is a multi-victim deadlock but I cannot re-create a deadlock graph such as this one. Also, why does it only show one victim?

Any help or advice would be most appreciated.

Andrew

6
  • 1
    The graph in the image has one victim. We would need to see the XML behind the graph to analyze the situation.
    – Jon Seigel
    Commented Apr 9, 2014 at 17:07
  • I cannot post the XML as it contains object names. Do you know of any reference material that would explain the above situation? Why does the victim only have one request? Commented Apr 10, 2014 at 15:53
  • I've been going through the XML and that only shows one deadlock victim so I am starting to think that the advice of it being a multi-victim deadlock was incorrect. However, it does not explain why the top process was selected as the victim. By killing that process it does not resolve the conflict, am I missing something? – Commented Apr 10, 2014 at 16:45
  • Hmmm... I'm not sure if the deadlock monitor will kill more than one process at a time, because it would have to re-evaulate the lock hierarchy after every kill. There may be a second deadlock detection and kill of the process on the left; check to see if that one was captured in a separate report (note that it may be several seconds after this one).
    – Jon Seigel
    Commented Apr 10, 2014 at 17:36
  • Hi Jon, thanks for coming back to me. I've had a look in the error log and there was another deadlock recorded just after the initial one. The victim from the initial deadlock is present in the second graph with more detail (i.e. an acquired and requested lock). Thank you, Andrew Commented Apr 11, 2014 at 10:03

1 Answer 1

1

I suppose this graph is coming out of SQL Profiler. Profiler behaves this way. it cannot display multi-victim deadlocks correctly. If you pick the very same deadlock from the system_health extended events session (no extra trace necessary as this one is running by default), you can get the correct visual within Extended Events Viewer. Also you can use this link to get a free deadlock collector and parser which also gets that information and the graphs: https://sqldeadlockcollector.codeplex.com/

  • as requested: yes, I am the person who created the deadlock collector which is free for anyone to download&use
2
  • 1
    If you are promoting something you have created, even if it's free, please disclose your affiliation with the tool Commented Jul 15, 2015 at 9:34
  • The information is coming out of XML recorded in the error log as I've enabled trace flag 1222. The initial graph is only part of the picture, SQL recorded another deadlock immediately afterwards with extra information that explained the initial graph. Commented Jul 16, 2015 at 10:39

Your Answer

By clicking “Post Your Answer”, you agree to our terms of service and acknowledge you have read our privacy policy.

Not the answer you're looking for? Browse other questions tagged or ask your own question.