Skip to the last paragraph for the summary-version
I am dealing with a SQL Server 2008 R2 Express installation. I have a fairly complex stored procedure. Depending upon the inputs, it may return 6500 records.
Each record is a web order. It returns 80 fields. Also, there is a bit of grouping to sum up line-item information and complex filtering on the SPROC itself. Almost always, this query runs in 2 seconds.
Sometimes, when the query runs with the minimal amount of filtering that will result in all 6500 rows returning, the database server enters an error state of some sort.
The CPU spikes to 100% and stays there. Sometimes it exits this state after a few minutes, sometimes it stays there until I reset the SQL Service.
If I reset the SQL Service during this error condition, then run the query again, normally I will be able to run it a hundred times without the error condition repeating. However, as the database ages (and expands) this error condition is becoming more and more common.
Here's what I know
I have analyzed the execution plan and likely have indexes on the appropriate fields in the appropriate tables
These indexes are rebuilt nightly
The error state lasts longer than it used to, on average.
Rebuilding the indexes seems to help when this error condition has just occurred (before resetting the SQL Service). I am including this here because maybe it has something to do with internal stats? More often than not, I just have to reset the sql service now.
As far as I can tell, the execution plan looks relatively healthy. You can see the busiest quarter of the plan here: https://i.sstatic.net/Uq2el.png Note: I am showing this portion due to the 3 underlined items.
- I have experimented with changing the joins for those 2 of those 3 items to hash joins, but it actually seems to slow it down further.
On beefier hardware, I have not encountered this error condition. For a variety of reasons, it I need to stay on the limited hardware for the production version.
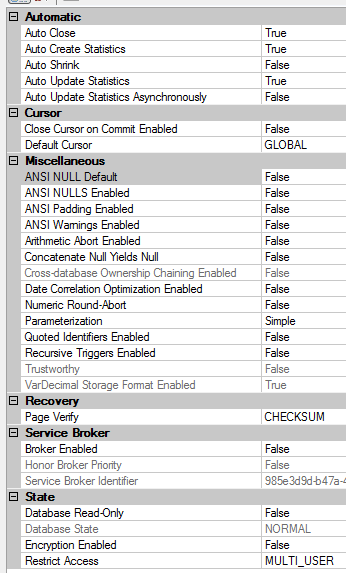
DB Properties:

My hosting resources are fairly minimal.
- ~2.5 Ghz single core
- 1.7 GB RAM
- 30 GB drive, 6GB Free
With that said, the DB server is "happy" almost all the time, except when this error condition is trigger by this specific SPROC.
I really can't show my code here, though I'd like to.
I wonder if some sort of internal maintenance is being triggered? Is it possible for SQL Server to enter an infinite loop? (I utilize no loops in my code).
Is there a good set of debugging tips for handling this situation:?
Sometimes when a query runs, it triggers a state where SQL Server uses 100% of CPU for 90 seconds to 20+ minutes. 98% of the time when the query runs, there is no problem at all, but this 98% is shrinking slowly over time.
2012 Update
- I setup a job that rebuilds all database indexes each night.
- Auto Close has been set to False
This largely mitigated the problem. However, I still do have some issues, but they come up about 5% as often, which I still have not solved.
