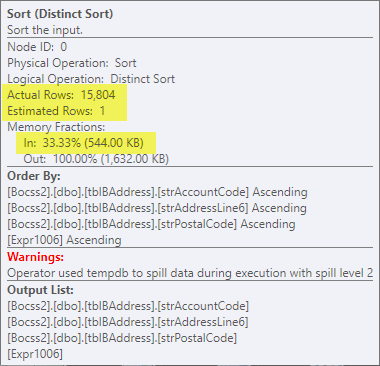
I am struggling to minimise the cost of sort operation on a query plan with the warning Operator usedtempdbto spill data during execution with spill level 2
I have found several posts related to spill data during execution with spill level 1, but not level 2. Level 1 seems to be caused bu outdated statistics, what about level 2? I could not find anything related to level 2.
I found this article very interesting related to Sort warnings:
Never Ignore a Sort Warning in SQL Server
My Sql Server?
Microsoft SQL Server 2014 (SP2) (KB3171021) - 12.0.5000.0 (X64) Jun 17 2016 19:14:09 Copyright (c) Microsoft Corporation Enterprise Edition (64-bit) on Windows NT 6.3 (Build 9600: ) (Hypervisor)
My Hardware?
running the query below for find the harware:
-- Hardware information from SQL Server 2012
SELECT cpu_count AS [Logical CPU Count], hyperthread_ratio AS [Hyperthread Ratio],
cpu_count/hyperthread_ratio AS [Physical CPU Count],
physical_memory_kb/1024 AS [Physical Memory (MB)], affinity_type_desc,
virtual_machine_type_desc, sqlserver_start_time
FROM sys.dm_os_sys_info WITH (NOLOCK) OPTION (RECOMPILE);
currently allocated memory
SELECT
(physical_memory_in_use_kb/1024) AS Memory_usedby_Sqlserver_MB,
(locked_page_allocations_kb/1024) AS Locked_pages_used_Sqlserver_MB,
(total_virtual_address_space_kb/1024) AS Total_VAS_in_MB,
process_physical_memory_low,
process_virtual_memory_low
FROM sys.dm_os_process_memory;
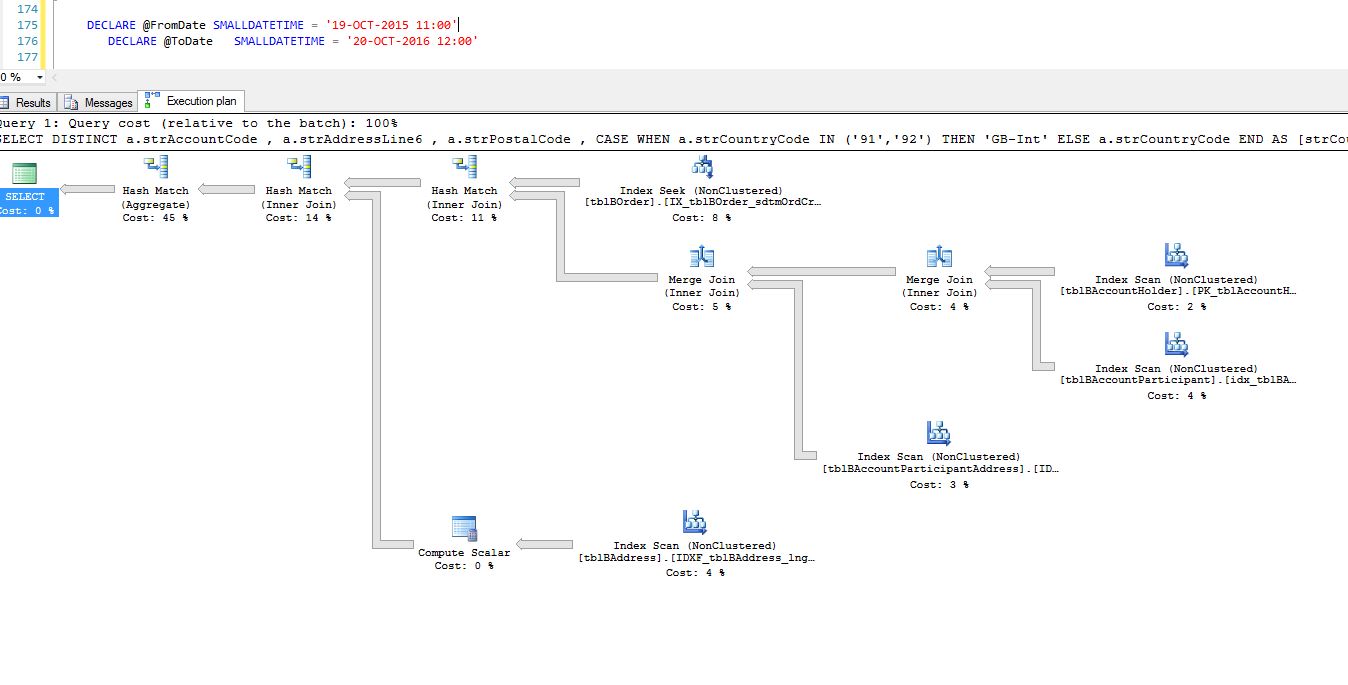
when I run my query with one year scope I don't get any warning whatsoever, as per the picture below:
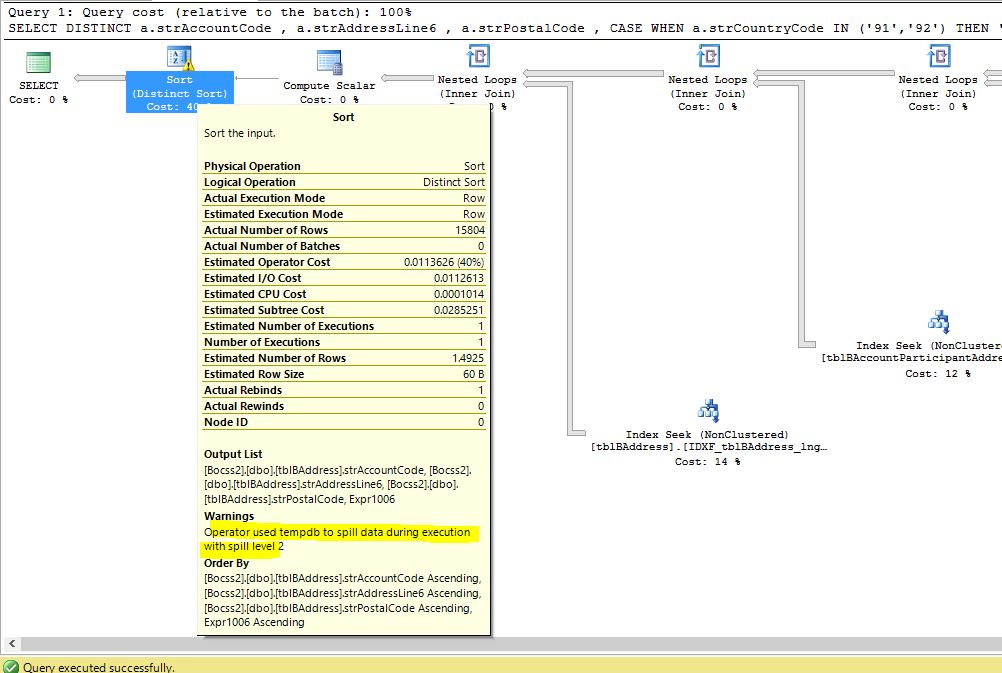
But when I run it only for 1 day scope I get this warning on the sort operator:
this is the query:
    DECLARE @FromDate SMALLDATETIME = '19-OCT-2016 11:00'
    DECLARE @ToDate   SMALLDATETIME = '20-OCT-2016 12:00'


    SELECT      DISTINCT
                a.strAccountCode ,
                a.strAddressLine6 ,
                a.strPostalCode ,
                CASE    WHEN a.strCountryCode IN ('91','92') THEN 'GB-Int'
                        ELSE a.strCountryCode
                        END AS [strCountryCode]
    FROM        Bocss2.dbo.tblBAccountParticipant AS ap
    INNER JOIN  Bocss2.dbo.tblBAccountParticipantAddress AS apa ON ap.lngParticipantID = apa.lngParticipantID
                                                                AND apa.sintAddressTypeID = 2
    INNER JOIN  Bocss2.dbo.tblBAccountHolder AS ah ON ap.lngParticipantID = ah.lngParticipantID
    INNER JOIN  Bocss2.dbo.tblBAddress AS a ON apa.lngAddressID = a.lngAddressID
                                            AND a.blnIsCurrent = 1
    INNER JOIN  Bocss2.dbo.tblBOrder AS o ON ap.lngParticipantID = o.lngAccountParticipantID
                                        AND o.sdtmOrdCreated >= @FromDate
                                        AND o.sdtmOrdCreated < @ToDate

OPTION(RECOMPILE)
the query plan using pastetheplan
Questions: 1) in the query plan I see this:
StatementOptmEarlyAbortReason="GoodEnoughPlanFound" CardinalityEstimationModelVersion="70"
why 70? I am using sql server 2014
2) how do I get rid of that sort operator (if at all possible)?
3) I have seen page life expectation pretty low, apart adding more memory to this server, is there any other thing I can have a look at to see if I can prevent this warning?
cheers
Update after the answer from Shanky and Paul White
I have checked my statistics according to the script below, and they seem all correct and updated.
these are all indexes and tables used in this query.
DBCC SHOW_STATISTICS ('dbo.tblBAddress','IDXF_tblBAddress_lngAddressID__INC')
GO
DBCC SHOW_STATISTICS  ('dbo.tblBOrder','IX_tblBOrder_sdtmOrdCreated_INCL')
GO
DBCC SHOW_STATISTICS ('dbo.tblBAccountHolder','PK_tblAccountHolder')
GO
DBCC SHOW_STATISTICS ('dbo.tblBAccountParticipant','PK_tblBAccountParticipants')
GO
DBCC SHOW_STATISTICS ('dbo.tblBAccountParticipantAddress','IDXF_tblBAccountParticipantAddress_lngParticipantID')
GO
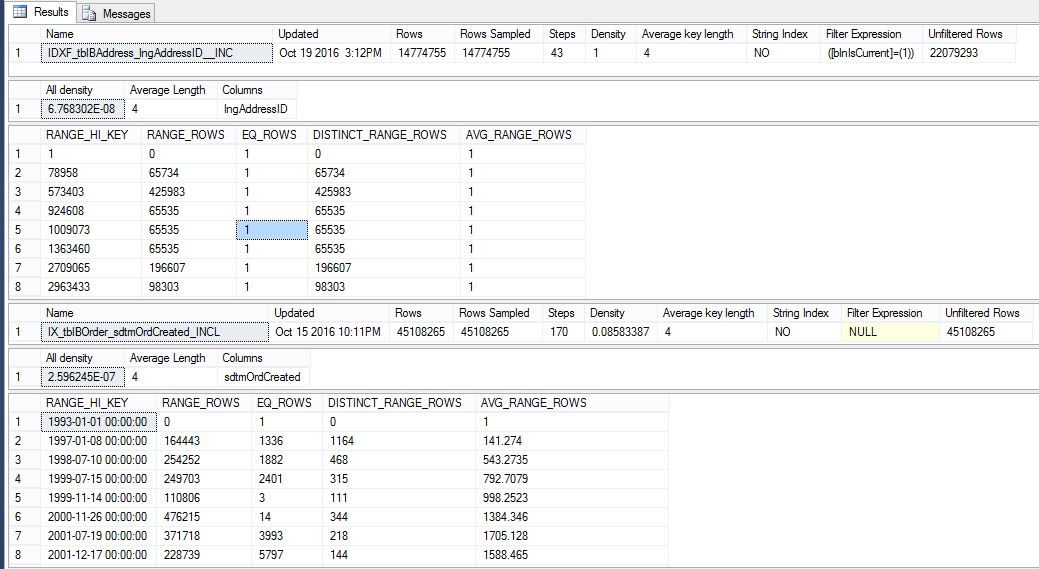
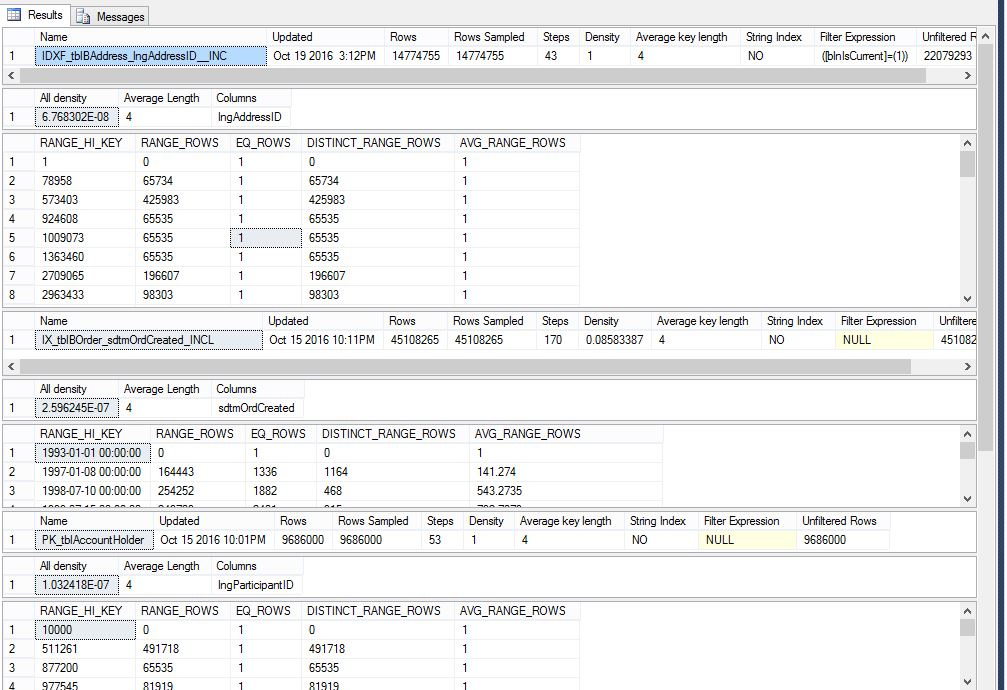
this is what I have got returned:
This is a partial results, but I have re-visited them all.
For statistics update I currently have Ola Hallengren
the Index Optimise Job - scheduled to run once a week - Sundays
EXECUTE [dbo].[IndexOptimize]
@Databases = 'USER_DATABASES,-%Archive',
@Indexes = 'ALL_INDEXES' ,
@FragmentationLow = NULL,
@FragmentationMedium = NULL,
@FragmentationHigh = NULL,
@PageCountLevel=1000,
@StatisticsSample =100
,@UpdateStatistics = 'Index',
@OnlyModifiedStatistics = 'Y',
@TimeLimit=10800,
@LogToTable = 'Y'
Although the stats seemed to be updated After I run the following script, I got no more warning on the sort operator.
UPDATE STATISTICS [Bocss2].[dbo].[tblBOrder]  WITH FULLSCAN
--1 hour  04 min 14 sec

UPDATE STATISTICS [Bocss2].[dbo].tblBAddress  WITH FULLSCAN
-- 45 min 29 sec

UPDATE STATISTICS  [Bocss2].[dbo].tblBAccountHolder WITH FULLSCAN
-- 26 SEC

UPDATE STATISTICS  [Bocss2].[dbo].tblBAccountParticipant WITH FULLSCAN
-- 4 min

UPDATE STATISTICS  [Bocss2].[dbo].tblBAccountParticipantAddress WITH FULLSCAN
-- 7 min 3 sec


