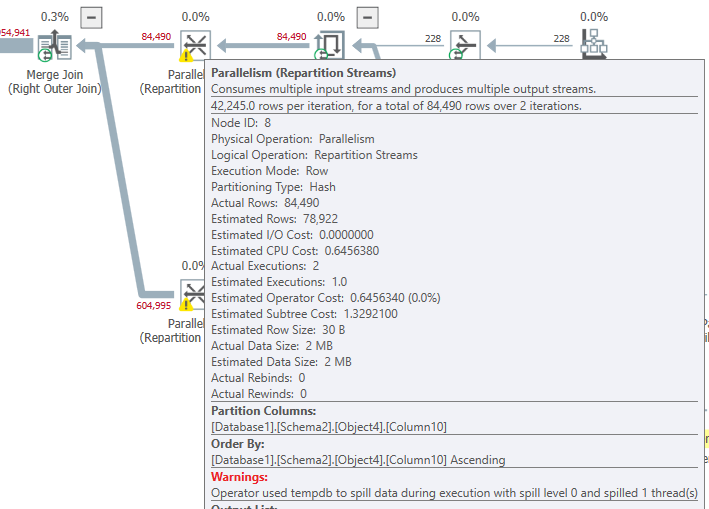
I was asked to look into performance of a query in SQL Server 2016 SP2, and I found something that I have not seen before:
<Warnings>
<SpillToTempDb SpillLevel="0" SpilledThreadCount="1" />
<ExchangeSpillDetails WritesToTempDb="237" />
</Warnings>
Does anyone have any information on "Spill level 0"?
Before everyone sends me off to lmgtfy.com - I've been there :-) and there is literally just a single result for this on Google; and on that page "Spill Level 0" is mentioned, but no other info.
I've looked in my SQL Server internals books, Bing.com, and so on. Nothing.
My guess is that it has something to do with control thread spilling over, or perhaps intra-query deadlock? The query itself is pretty basic; SELECT DISTINCT with 3 INNER JOINs, followed by 2 LEFT.
Any clue will be greatly appreciated.
And please note: The query performance has been fixed, but the mystery of that spill remains. I am not asking for help to improve this query - that's why it is not included here. I simply want to get an idea about spill 0.
Environment: SQL Server 2016 Ent. SP2 (no CUs) . MAXDOP = 4 set by RG., SSMS v18.5
I also include here a screenshot of these two operators in the plan.
Thank you!

