I want to analyse the Market capital of the Industry per Counterparty of the following table:
--------------------------------------------------
| CPTY | Industry      | Value   |
--------------------------------------------------
| a    | food          | 10      |
| a    | water         | 5       |
| c    | wood          | 20      |
| c    | food          | 20      |
| d    | wood          | 10      |
I would like a breakdown of percentages for each of the CPTY fields in relation to their child Industries.
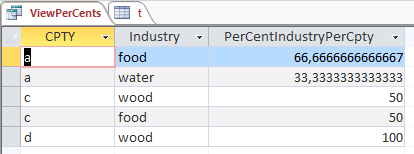
A sample of the output query I would expect should look like:
| CPTY | Industry      | Value   | %IndustryPerCpty
--------------------------------------------------
| a    | food          | 10      | 66.66
| a    | water         | 5       | 33.33
| c    | wood          | 20      | 50.0
| c    | food          | 20      | 50.0
| d    | wood          | 10      | 100.00
E.g. for CPTY a, the corresponding sectors are food and water. The total value for CPTY a is 10+5=15. Thus, food has 10/15*100% = 66.66% of the total market value for that CPTY. Likewise, water has 5/15 *100% = 33.33% of the total market value for that CPTY.
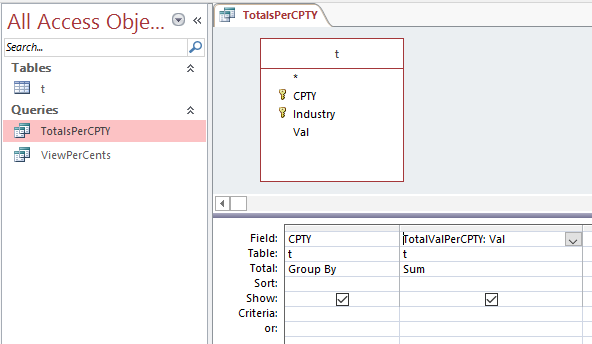
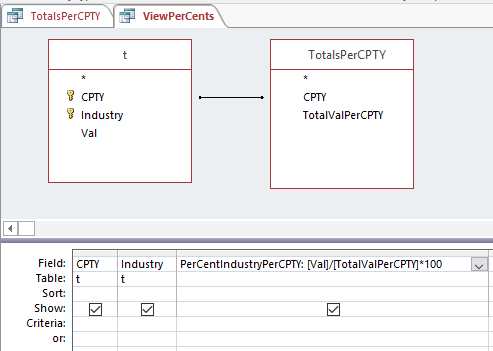
My original attempts at the query follow the structure adopted in accepted answer here. However, this gives me percentage composition for each row, not the Industry per CPTY.
Note: I don't expect the sum( %IndustryPerCpty ) column to equal 100%, for reasons I hope are clear.
Can anyone suggest a query structure in Ms Access to generate my desired table with %IndustryPerCpty fields?


