The View
CREATE VIEW [dbo].[vProductList]
WITH SCHEMABINDING
AS

SELECT
     p.[Id]
    ,p.[Name]
    ,price.[Value] as CalculatedPrice
    ,orders.[Value] as OrdersWithThisProduct
FROM
    products as p
    INNER JOIN productMetadata as price ON p.Id = price.ProductId AND price.MetaId = 1
    INNER JOIN productMetadata as orders ON p.Id = orders.ProductId AND orders.MetaId = 2
For the sake of simplicity, assume that productMetadata has columns ProductId, MetaId, Value has ~87m rows, and there are about 400k rows in the products table.
General queries against this view work perfectly:
SELECT * FROM vProductList WHERE CalculatedPrice > 500
Query results in 2-4 seconds (over a vpn and remote, so I'm good with that).
Changing the above to a count is equally fast:
SELECT COUNT(*) from vProductList WHERE CalculatedPrice > 500
runs in about the same time as the raw select, which again I'm OK with. There are roughly 10k products meeting this criteria.
I've run into two separate instances where things get really odd and take FOREVER.
First
Doing a query against one of the columns from the base table in the view:
SELECT * FROM vProductList WHERE Name = 'Hammer'
This query takes a little while to run (20-30 seconds) and returns ~30k results; however, a slight change to said query:
SELECT COUNT(*) FROM vProductList WHERE Name = 'Hammer'
takes thirteen MINUTES to return a count stating ~30k .
Second
Doing a WHERE IN subquery
SELECT * FROM vProductList WHERE Id IN (SELECT ProductId FROM TableThatHasFKToProductId and ColumnInTable = 'Yes')
This query returns ~300k rows and takes two minutes to return (much of that time is simply spent downloading the data into SSMS I believe); however, changing that to a SELECT COUNT(*) results in a query that takes twenty minutes.
SELECT COUNT(*) FROM vProductList WHERE Id IN (SELECT ProductId FROM TableThatHasFKToProductId and ColumnInTable = 'Yes')
Why is it that SELECT * is faster than SELECT COUNT?
I am using the Total Execution Time provided by SSMS for all timings listed here.
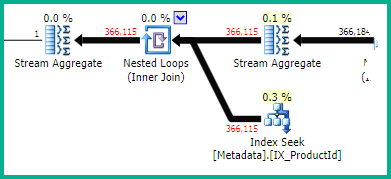
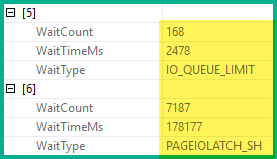
Execution plans
Note: I tried using PasteThePlan but it kept telling my the plan was invalid xml.


