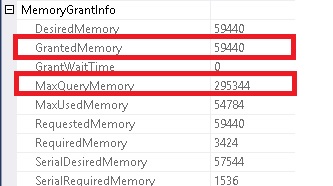
It's a snapshot of the same information that you can get from sys.dm_exec_query_resource_semaphores. I believe that it's target_memory_kb for the regular resource semaphore multiplied by the maximum query grant percent for the Resource Governor group that the query is executing in. If RG is not enabled then just use the default of 25%.
On the servers that I looked at, I generally see about 28% of server memory not available for query memory grants. So once I've run a workload the max query grant that's available for a query is 0.25 * 0.72 * MaxServerMemory.
Here's a query that you can run that finishes almost instantly but asks for a large memory grant:
DECLARE @zero INT = 0;

WITH CTE AS (
    SELECT high
    FROM master..spt_values
    WHERE @zero = 1
)
SELECT *
FROM CTE t1
CROSS JOIN CTE t2
CROSS JOIN CTE t3
ORDER BY t1.high + t2.high + t3.high;
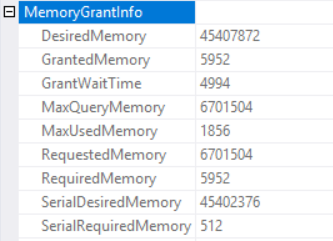
If I force that query to timeout then I get the following in the actual plan:

MaxQueryMemory does not change as a result of the timeout. It isn't directly affected by other queries currently executing and using query memory. It's indirectly affected by anything that changes target memory KB for the resource pool.
This information could be useful if you have a bunch of different Resource Governor pools and groups and want to validate that a query goes to the correct place. It can also provide context to the total size or configuration of a server that you don't have access to. It's another way to tell if a query timed out waiting for a memory grant, but there are already other ways to do that. The intended use case may be to give more information about performance problems caused by target memory changing quite a bit on servers, but I've never seen that happen personally. Maybe it can happen on servers with multiple instances of SQL Server running?


