Disclaimer: I'm a developer dwelling in databases, so my knowledge is limited
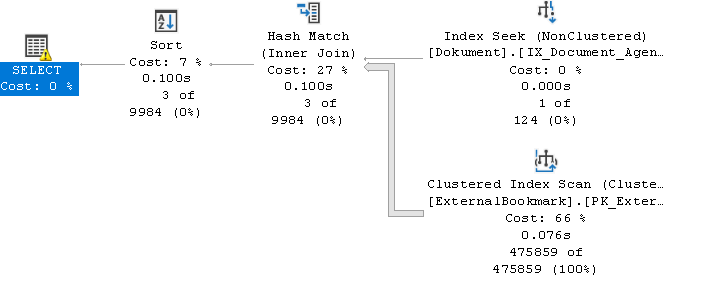
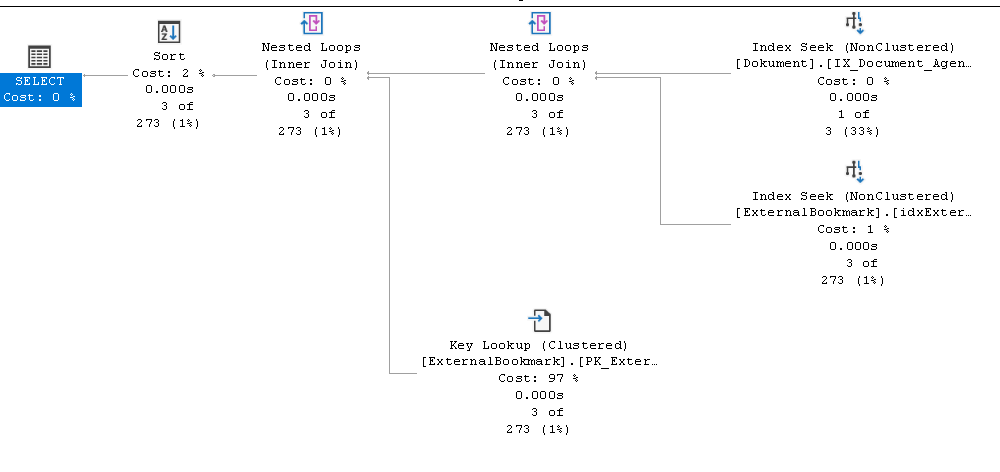
We recently upgraded our MSSQL Server from 2012 to 2022 and in that regard also updated the COMPATIBILITY_LEVEL from 110/2012 to 160/2022 (all indexes have been rebuilt). But I'm seeing some difference in execution plan for a specific table with 475.000 rows where in 110 it runs a key lookup and in 160 it runs a clustered index scan.
This results in a lot more logical reads with the clustered index scan compared to the key lookup.
So, I was wondering if it's a problem or if it's okay? Generally, I'm seeing a higher CPU usage in 160 compared to 110.
Query:
SET STATISTICS TIME ON
SET STATISTICS IO ON

SELECT [e].[Id], [e].[Title], [e].[Level], [e].[PageNumber], [e].[DocumentId], [e].[SortOrder]
FROM [ExternalBookmark] AS [e]
INNER JOIN [Dokument] AS [d] ON [e].[DocumentId] = [d].[Id]
WHERE [d].[AgendaItemId] = 16602592
ORDER BY [e].[SortOrder]
160:
Table 'Worktable'. Scan count 0, logical reads 0, physical reads 0, page server reads 0, read-ahead reads 0, page server read-ahead reads 0, lob logical reads 0, lob physical reads 0, lob page server reads 0, lob read-ahead reads 0, lob page server read-ahead reads 0.
Table 'Workfile'. Scan count 0, logical reads 0, physical reads 0, page server reads 0, read-ahead reads 0, page server read-ahead reads 0, lob logical reads 0, lob physical reads 0, lob page server reads 0, lob read-ahead reads 0, lob page server read-ahead reads 0.
Table 'ExternalBookmark'. Scan count 1, logical reads 6630, physical reads 0, page server reads 0, read-ahead reads 0, page server read-ahead reads 0, lob logical reads 0, lob physical reads 0, lob page server reads 0, lob read-ahead reads 0, lob page server read-ahead reads 0.
Table 'Dokument'. Scan count 1, logical reads 3, physical reads 0, page server reads 0, read-ahead reads 0, page server read-ahead reads 0, lob logical reads 0, lob physical reads 0, lob page server reads 0, lob read-ahead reads 0, lob page server read-ahead reads 0.
https://www.brentozar.com/pastetheplan/?id=SybVG68Z0
110:
Table 'Worktable'. Scan count 0, logical reads 0, physical reads 0, page server reads 0, read-ahead reads 0, page server read-ahead reads 0, lob logical reads 0, lob physical reads 0, lob page server reads 0, lob read-ahead reads 0, lob page server read-ahead reads 0.
Table 'ExternalBookmark'. Scan count 1, logical reads 15, physical reads 0, page server reads 0, read-ahead reads 0, page server read-ahead reads 0, lob logical reads 0, lob physical reads 0, lob page server reads 0, lob read-ahead reads 0, lob page server read-ahead reads 0.
Table 'Dokument'. Scan count 1, logical reads 3, physical reads 0, page server reads 0, read-ahead reads 0, page server read-ahead reads 0, lob logical reads 0, lob physical reads 0, lob page server reads 0, lob read-ahead reads 0, lob page server read-ahead reads 0.
https://www.brentozar.com/pastetheplan/?id=H1rsM68WR
I tried with both FORCE_LEGACY_CARDINALITY_ESTIMATION and DISALLOW_BATCH_MODE hints, but it's still using clustered index scan. I also tried updating statistics without fullscan for the two tables involved (ExternalBookmark and Dokument) but still no luck.


