0

My manager has asked me to work upon a request. I am not sure if it is reasonable or weird but he wants me to setup an alert based on the "waiting task" that we see in the activity monitor. Basically, if the value in the "waiting task" goes above 10 then we need to be alerted upon. I am not sure as to how I would replicate the same information that we see in Activity monitor as this seems to be live data. Closest DMV and the column I could think of is "waiting_tasks_count" in sys.dm_os_wait_stats. However, this does not seem to be in line with what he is looking for and the column consists of cumulative values over a period of time since last time SQL was restarted. Can someone shed some light on where I can find a query or a counter that I can alert upon?

I have thought about a query at this time but I think I can't calculate the delta correctly it always shows me 1. Can someone help me out exactly where I am going wrong here.

select  so1.wait_type,
        so1.waiting_tasks_count as no_of_waits,
        so1.waiting_tasks_count - so2.waiting_tasks_count as delta_wait_count,
        so1.signal_wait_time_ms,
        so1.wait_time_ms - so2.signal_wait_time_ms as resource_wait_time,
        getdate() as sample_time
from  sys.dm_os_wait_stats as so1
inner join sys.dm_os_wait_stats as so2
on so2.waiting_tasks_count = so1.waiting_tasks_count - 1
4
  • Do you mean (or your manager) when count of sys.dm_os_waiting_tasks goes over 10, get alerted. You will need to exclude some wait_types like SLEEP_TASK, CXPACKET, WAITFOR. Or may be your manager is asking for when more than 10 process blocked. Commented Aug 1, 2017 at 12:29
  • I suggest you talk to your manager and ask for more details before you implement or seek for a solution. Commented Aug 1, 2017 at 12:42
  • @F.Farouqi, Is it enough to alert when lock waits is above 10? In that case see my answer. If not ignore it. :) Commented Aug 1, 2017 at 12:47
  • Maybe your manager means blocking instead of waiting? Blocking threads are more useful to be aware of, in my opinion. Commented Aug 1, 2017 at 12:54

2 Answers 2

1

you can trace out the exact query in profiler..below is the query you are referring to

WITH profiled_sessions as (
    SELECT DISTINCT session_id profiled_session_id from sys.dm_exec_query_profiles
)
SELECT 
   [Session ID]    = s.session_id, 
   [User Process]  = CONVERT(CHAR(1), s.is_user_process),
   [Login]         = s.login_name,   
   [Database]      = case when p.dbid=0 then N'' else ISNULL(db_name(p.dbid),N'') end, 
   [Task State]    = ISNULL(t.task_state, N''), 
   [Command]       = ISNULL(r.command, N''), 
   [Application]   = ISNULL(s.program_name, N''), 
   [Wait Time (ms)]     = ISNULL(w.wait_duration_ms, 0),
   [Wait Type]     = ISNULL(w.wait_type, N''),
   [Wait Resource] = ISNULL(w.resource_description, N''), 
   [Blocked By]    = ISNULL(CONVERT (varchar, w.blocking_session_id), ''),
   [Head Blocker]  = 
        CASE 
            -- session has an active request, is blocked, but is blocking others or session is idle but has an open tran and is blocking others
            WHEN r2.session_id IS NOT NULL AND (r.blocking_session_id = 0 OR r.session_id IS NULL) THEN '1' 
            -- session is either not blocking someone, or is blocking someone but is blocked by another party
            ELSE ''
        END, 
   [Total CPU (ms)] = s.cpu_time, 
   [Total Physical I/O (MB)]   = (s.reads + s.writes) * 8 / 1024, 
   [Memory Use (KB)]  = s.memory_usage * (8192 / 1024), 
   [Open Transactions] = ISNULL(r.open_transaction_count,0), 
   [Login Time]    = s.login_time, 
   [Last Request Start Time] = s.last_request_start_time,
   [Host Name]     = ISNULL(s.host_name, N''),
   [Net Address]   = ISNULL(c.client_net_address, N''), 
   [Execution Context ID] = ISNULL(t.exec_context_id, 0),
   [Request ID] = ISNULL(r.request_id, 0),
   [Workload Group] = ISNULL(g.name, N''),
   [Profiled Session Id] = profiled_session_id
FROM sys.dm_exec_sessions s LEFT OUTER JOIN sys.dm_exec_connections c ON (s.session_id = c.session_id)
LEFT OUTER JOIN sys.dm_exec_requests r ON (s.session_id = r.session_id)
LEFT OUTER JOIN sys.dm_os_tasks t ON (r.session_id = t.session_id AND r.request_id = t.request_id)
LEFT OUTER JOIN 
(
    -- In some cases (e.g. parallel queries, also waiting for a worker), one thread can be flagged as 
    -- waiting for several different threads.  This will cause that thread to show up in multiple rows 
    -- in our grid, which we don't want.  Use ROW_NUMBER to select the longest wait for each thread, 
    -- and use it as representative of the other wait relationships this thread is involved in. 
    SELECT *, ROW_NUMBER() OVER (PARTITION BY waiting_task_address ORDER BY wait_duration_ms DESC) AS row_num
    FROM sys.dm_os_waiting_tasks 
) w ON (t.task_address = w.waiting_task_address) AND w.row_num = 1
LEFT OUTER JOIN sys.dm_exec_requests r2 ON (s.session_id = r2.blocking_session_id)
LEFT OUTER JOIN sys.dm_resource_governor_workload_groups g ON (g.group_id = s.group_id)
LEFT OUTER JOIN sys.sysprocesses p ON (s.session_id = p.spid)
LEFT OUTER JOIN profiled_sessions ON profiled_session_id = s.session_id
ORDER BY s.session_id;
0

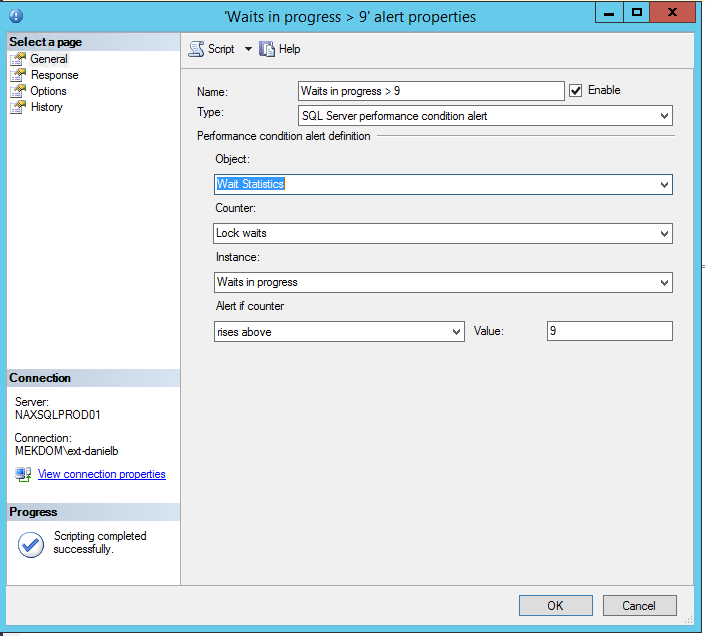
You can in the SQL Agent under Alerts do this. (This images states rise above 9 and not 10 as you want but the concept is the same. On the Response tab you can choose beteen execute a job or send email.

This will give you only Lock Waits thou.

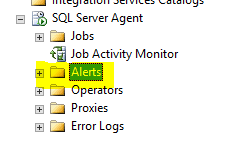
Create a "new alert"

enter image description here

Configure the alert to trigger on waits:

enter image description here

5
  • 1
    That is only looking at lock waits, how about other ones? Commented Aug 1, 2017 at 12:29
  • You are right. It might be that you are not able to do it with performance counter wait statistics. Maybe you need to use a SQL query instead. Commented Aug 1, 2017 at 12:40
  • Notes from my manager - I've been using the Activity Monitor (I attached a screenshot). Prior to our upgrade, I used to see the 4 counters constantly in motion; there were ALWAYS waiting tasks, or it seemed that way. So when performance issues happened, it was always very difficult to know what was causing them.
    – Feivel
    Commented Aug 1, 2017 at 15:27
  • Contunuation of the notes - Last week, a user kicked off a delete in our payroll_weekly table. I happened to be in the office and immediately saw the WAITING TASKS spike. I also heard users at their desks say "The system is frozen!" I was able to log on and find the offending job (the delete). So my though was: If I can get an alert when those jobs spike, I can at least have some time to jump on and see what's happening, then work to stop whatever it is in the future.
    – Feivel
    Commented Aug 1, 2017 at 15:27
  • There will always be waiting tasks and thats normal but when something is "locked" (blocked) its because some other thread is blocking it. That is more likely what you want to monitor. Commented Aug 2, 2017 at 13:48

Your Answer

By clicking “Post Your Answer”, you agree to our terms of service and acknowledge you have read our privacy policy.

Not the answer you're looking for? Browse other questions tagged or ask your own question.